 geo.be Metadata Catalog
Federal Atom
Type of resources
Available actions
Topics
INSPIRE themes
federalThemes
Keywords
Contact for the resource
Provided by
Years
Formats
Representation types
Update frequencies
status
Service types
Scale
Resolution
-

This AtomFeed download service provides access to federal datasets that are not reported under the INSPIRE Directive. The datasets can be accessible for free or under conditions.
-
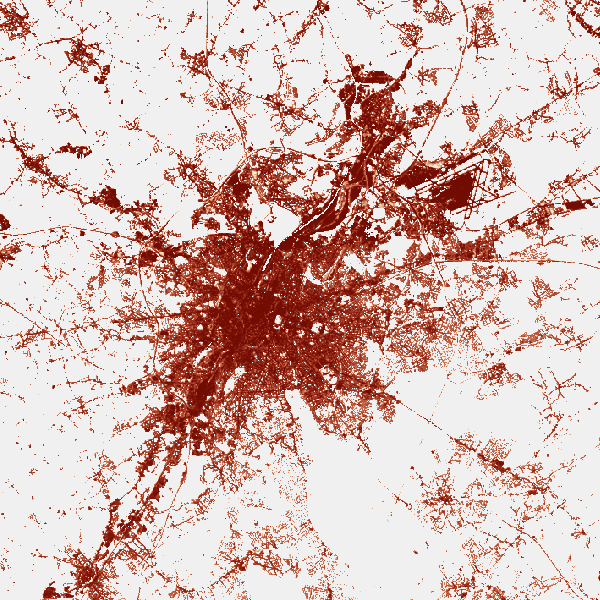
The product is made of 5 "high resolution layers" covering all the Belgian territory as part of a European-wide coverage for the reference year 2015. The 5 layers concern 4 distinct themes: Imperviousness, Forest, Grasslands, Wetness and Water. The 5 layers were produced by an automatic classification based on satellite images and collateral data and achieved by private companies (EEA service providers), and they were verified by Belgium. At the Belgian level, verification and enhancements were made by IV for the northern part and SPW for the outhern part. The NGI coordinated the project. Data was produced with funding by the European Union. Copyright Copernicus Programme DISCLAIMER: National Geographic Institute has undertaken to distribute the data on behalf of EEA under Specific Contract No 3436/R0-Copernicus/EEA.57005 implementing Framework service contract No EEA/IDM/R0/16/009/Belgium. National Geographic Institute accepts no responsibility or liability whatsoever with regard to the content and use of these data.” The European Environment Agency accepts no responsibility or liability whatsoever with regard to the information on this site and the information does not necessarily reflect the official opinion of the EEA or other European Communities bodies and institutions.
-
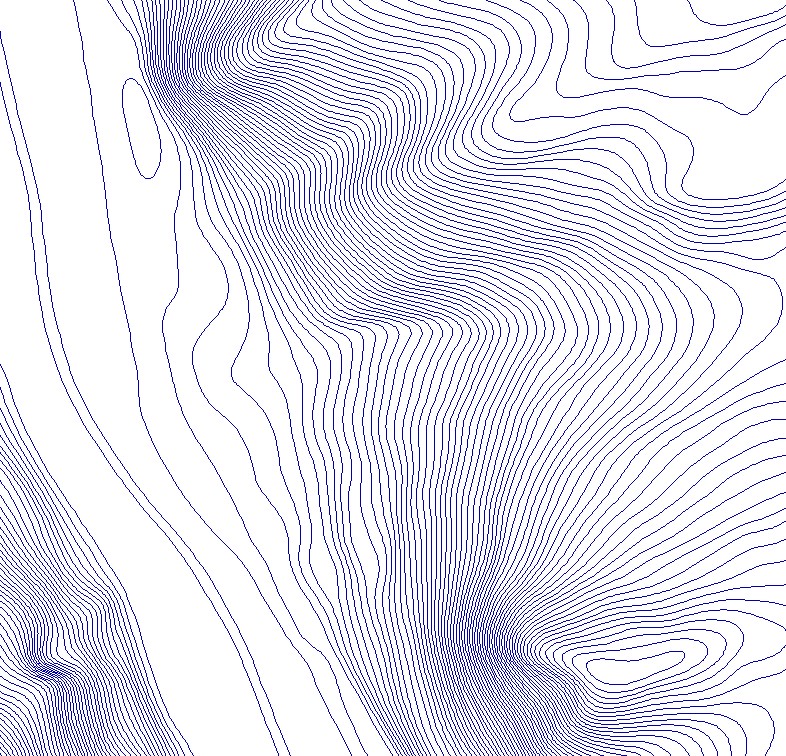
The contour lines are the set of lines connecting all points at the same elevation in a model used to represent the relief on a large scale.
-
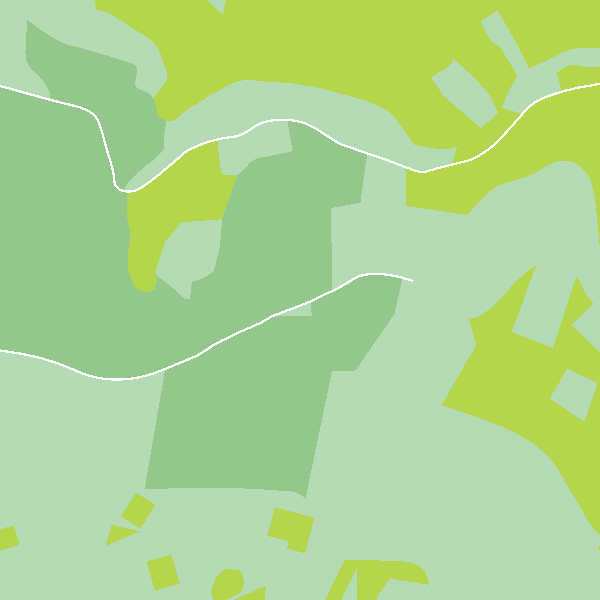
Top10Vector – Land cover and vegetation is the vector data set of the land use of unbuilt land areas in Belgium. This data set includes three classes. First class: dry and unbuilt areas or areas not used as roads. Second class: hedges. Third class: linear vegetation. This data set can be bought via the corresponding hyperlink.
-
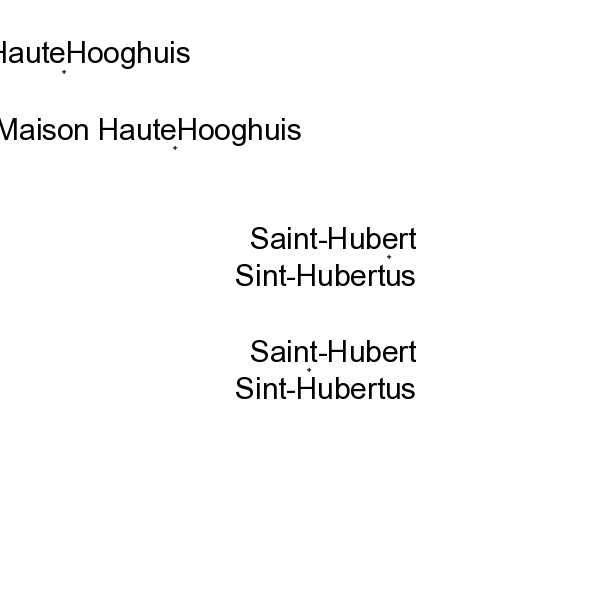
The layer Geographical Names includes all the names of administrative units, uninhabited places, waterways, remarkable buildings and infrastructures. They are classified into different feature and attribute classes.
-
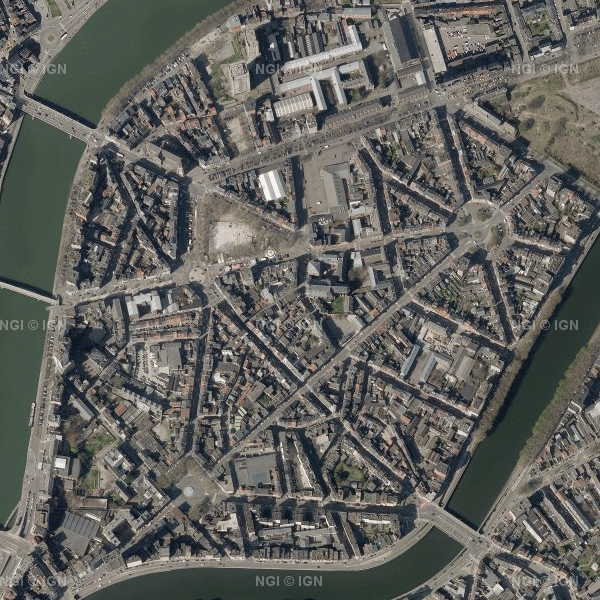
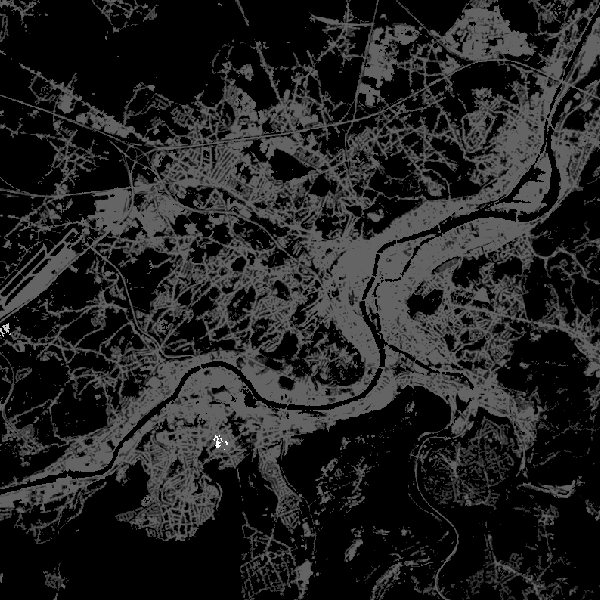
Orthophotos are digital aerial photographs that have been adjusted for lens distortion, topographic relief and camera tilt. This cover is renewed every three years.The orthophotographs have a minimal resolution of 50 cm. The dataset is generated from the harmonisation of the datasets owned by the Belgian administrative regions.The dataset is INSPIRE compliant. The dataset is downloadable per NGI mapsheet at scale 1:50000.
-
The files contain the population characteristics (total, gender and/or age groups) by municipality in Belgium on January 1st, according to the Belgian definition of the population. The Belgian definition does not take into account the 12-months criterion and excludes asylum seekers. More information at https://ec.europa.eu/eurostat/cache/metadata/en/demo_pop_esms.htm#unit_measure1589188532500.
-
The product is made of 6 "high resolution layers" covering all the Belgian territory as part of a European-wide coverage. The 6 layers concern 6 distinct themes: Imperviousness, Tree cover density, Forest type, Permanent grasslands, Wetlands and Permanent waterbodies. The 6 layers were produced by an automatic classification based on satellite images and collateral data and achieved by private companies (EEA service providers), and they were verified and enhanced by Belgium. At the Belgian level, verification and enhancements were made by AGIV for the northern part and SPW for the southern part. The NGI coordinated the project.
-
The files contain the population characteristics (total, gender and/or age groups) by 1 km² square grid cell in Belgium on January 1st, according to the European definition of the population. The European definition takes into account the 12-months criterion and includes asylum seekers. More information at https://ec.europa.eu/eurostat/cache/metadata/en/demo_pop_esms.htm#unit_measure1589188532500.
-
The dataset shows in the form of polygons the sand and gravel extraction sites in the Belgian marine areas as defined by the successive marine spatial plans. A 2014 version illustrates the 2014-2020 plan while the 2020 version illustrates the 2020-2026 plan.