 geo.be Metadata Catalog
hydrography
Type of resources
Available actions
Topics
INSPIRE themes
federalThemes
Keywords
Contact for the resource
Provided by
Years
Formats
Representation types
Update frequencies
status
Service types
Scale
-
The entities included in the dataset represent the physical network in the sense of the Inspire European directive. The dataset comprises several classes and is in accordance with the INSPIRE specifications. The Wetland class represents poorly drained or periodically flooded portions of land, the soil of which is saturated with water but where vegetation is nevertheless able to develop. The StandingWater class represents flooded areas that are, nevertheless, completely surrounded by land.
-
This web service allows viewing the NGI data which comply with the INSPIRE specifications. It gives an overview of the INSPIRE data which are for sale.
-
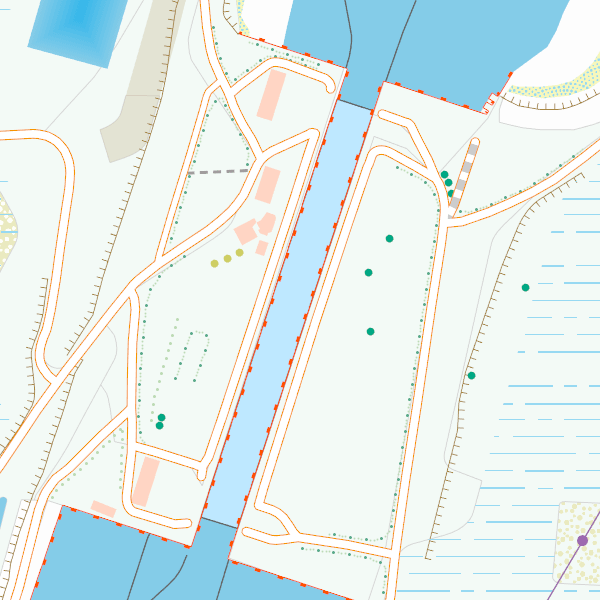
s'Top10Vector – Hydrography' is the dataset of the Belgian hydrography. This dataset comprises 6 feature types. The basis of the hydrographic network is formed by watercourse segments [HY_watercoursesegment]. The surface of larger watercourses is represented by watercourse surfaces [HY_watercoursesurface]. Water surfaces [HY_watersurface] and wetlands [HY_wetland] are also included in the dataset. Water points [HY_waterpoint] are point features where water reaches the land surface naturally or disappears into the subsoil. Another type of point feature is the kilometre marker [HY_waterwaykilometremarker]. The dataset can be downloaded via the links in 'Access' at the bottom of this page.
-
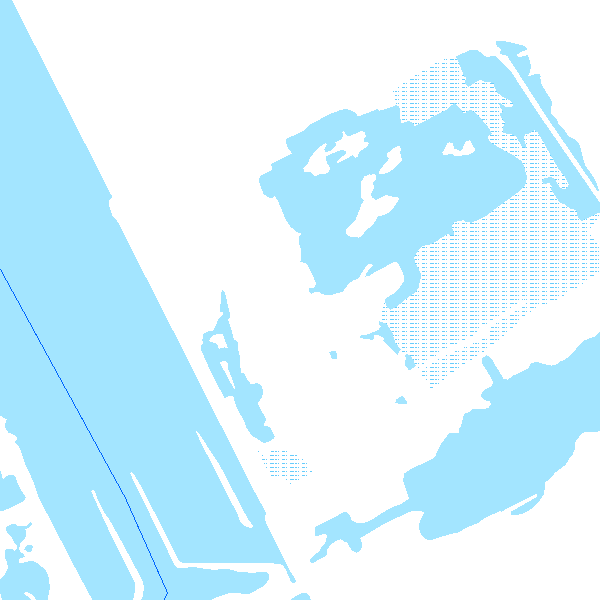
This dataset is part of the 2018 Belgian submission for the Marine Strategy Framework Directive (MSFD) linked to descriptor 7, criterion 1. This dataset describes the impact of an offshore windmills farm on the hydrodynamics in the Belgian part of the North Sea (BPNS). Originally, it is a NetCDF file with the results of the reference simulation made with the COHERENS (COupled Hydrodynamical Ecological model for REgioNal Shelf seas) hydrodynamic model only forced by tides (no wind effect). Model resolution : ~ 12.5m. It contains both the reference situation which is a simulation without any windmill and the modeling result of the influence by the windmills on the hydrodynamic in the BPNS. The dataset contains the results on the most inner nested grid level for one reference spring-neap cycle: - hourly sea surface elevation - hourly bottom shear stress - hourly 3D horizontal velocity components (u,v) - hourly 3D eddy viscosity - time-averaged bottom shear stress over the reference spring-neap cycle - percentile 90 of the bottom shear stress for the reference spring-neap cycle - percentile 90 of the specific kinetic energy at the sea bed - accumulated time during which sedimentation processes are dominant - accumulated time during which re-suspension processes are dominant.
-
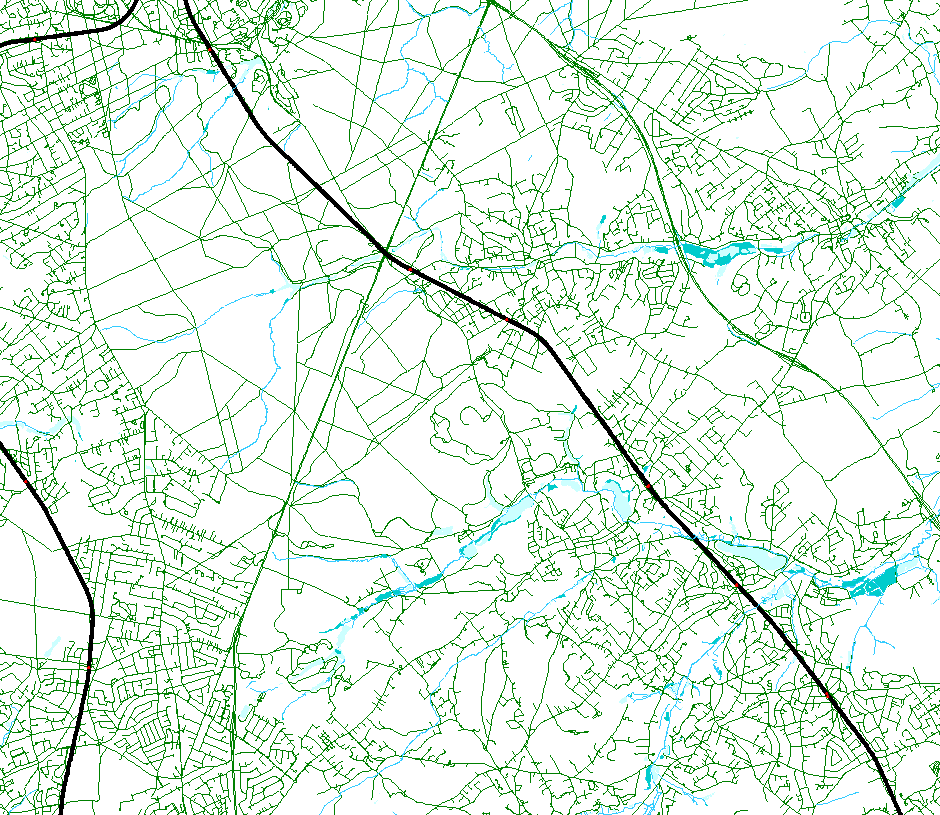
CartoWeb.be is a Web Service (WMTS/WMS) containing cartographic representations covering 11 scale levels. CartoWeb.be offers a cartographic representation which has been developed specifically for on-screen viewing of the NGI’s most recent vector data sets. Three versions are available for the Belgian territory: 1) a TOPO layer containing a cartographic representation at all scales; 2) a TOPO-GREY layer, which is the symbolisation in different shades of grey and blue of the TOPO layer. It constitutes an ideal map background; 3) an OVERLAY (1:2 500 - 1:25 000) layer destined to be used as an overlay on other data (orthophotographs for instance). This layer contains the symbolisation of a few layers only. Two other layers, CROSSBORDER and CROSSBORDER-GREY, are available in order to allow viewing (only on the smallest scales 1:100 000 – 1:4 000 000) the European context of Belgium. The extent of this representation is limited and could change in the following versions. It is best to combine the CROSSBORDER layer with the TOPO layer. It is best to combine the CROSSBORDER-GREY layer with the TOPO-GREY-layer.
-
This webservice allows the Top10Vector product, containing topographical vector data covering the whole of Belgium, to be visualised. The product consists of 35 feature types grouped into 8 different topics: ‘Constructions, ‘Particular zones, ‘Land cover and vegetation, ‘High-tension network, ‘Hydrography’, ‘Local relief’, ‘Railway network’ and ‘Road network’. The link to the webservice is available under 'Access' at the bottom of this page.