 geo.be Metadata Catalog
2017
Type of resources
Available actions
Topics
INSPIRE themes
federalThemes
Keywords
Contact for the resource
Provided by
Years
Formats
Representation types
Update frequencies
status
Service types
Scale
-
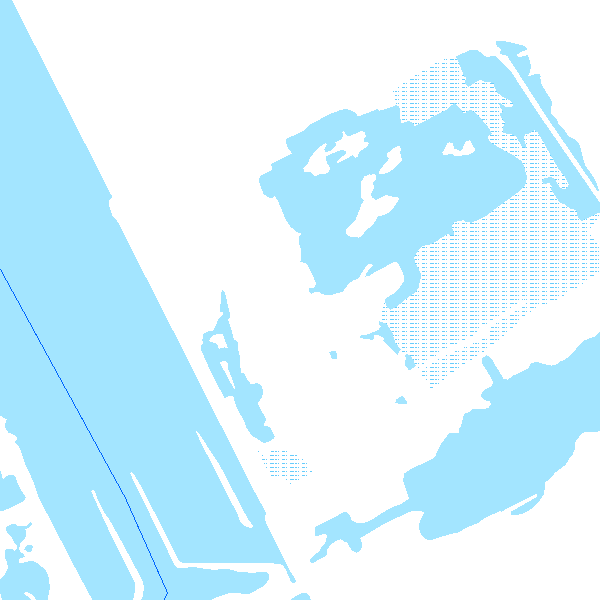
The entities included in the dataset represent the physical network in the sense of the Inspire European directive. The dataset comprises several classes and is in accordance with the INSPIRE specifications. The Wetland class represents poorly drained or periodically flooded portions of land, the soil of which is saturated with water but where vegetation is nevertheless able to develop. The StandingWater class represents flooded areas that are, nevertheless, completely surrounded by land.
-
Network of marks whose planimetric coordinates are known with precision according to the reference systems which are used in Belgium.
-
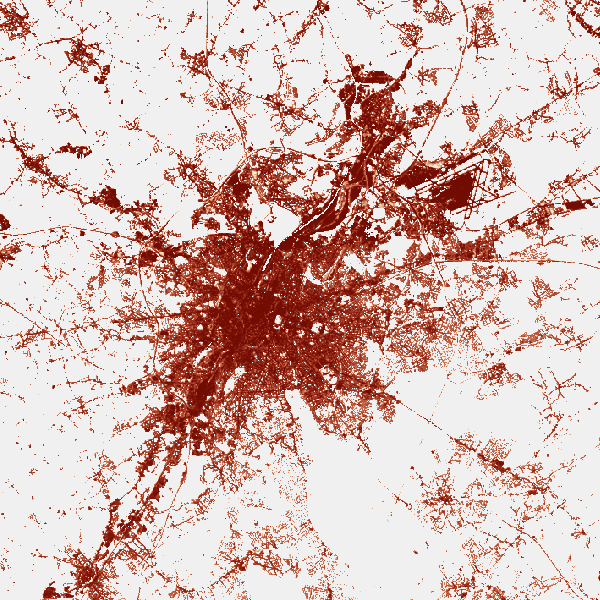
The product is made of 5 "high resolution layers" covering all the Belgian territory as part of a European-wide coverage for the reference year 2015. The 5 layers concern 4 distinct themes: Imperviousness, Forest, Grasslands, Wetness and Water. The 5 layers were produced by an automatic classification based on satellite images and collateral data and achieved by private companies (EEA service providers), and they were verified by Belgium. At the Belgian level, verification and enhancements were made by IV for the northern part and SPW for the outhern part. The NGI coordinated the project. Data was produced with funding by the European Union. Copyright Copernicus Programme DISCLAIMER: National Geographic Institute has undertaken to distribute the data on behalf of EEA under Specific Contract No 3436/R0-Copernicus/EEA.57005 implementing Framework service contract No EEA/IDM/R0/16/009/Belgium. National Geographic Institute accepts no responsibility or liability whatsoever with regard to the content and use of these data.” The European Environment Agency accepts no responsibility or liability whatsoever with regard to the information on this site and the information does not necessarily reflect the official opinion of the EEA or other European Communities bodies and institutions.
-
Whole of marks whose height with respect to the zero mark of the second general leveling is known.
-
The entities included in dataset represent the Belgian waterway transport network in the sense of the Inspire European directive. The dataset comprises several classes and is in accordance with the INSPIRE specifications. The class represents, in a linear manner, all of the waterway links between each pair of dots for the network considered. In addition to this is one class without geometry. The RestrictionForWaterCehicles class specifies for each segment the maximum tonnage of the building using the segment.
-
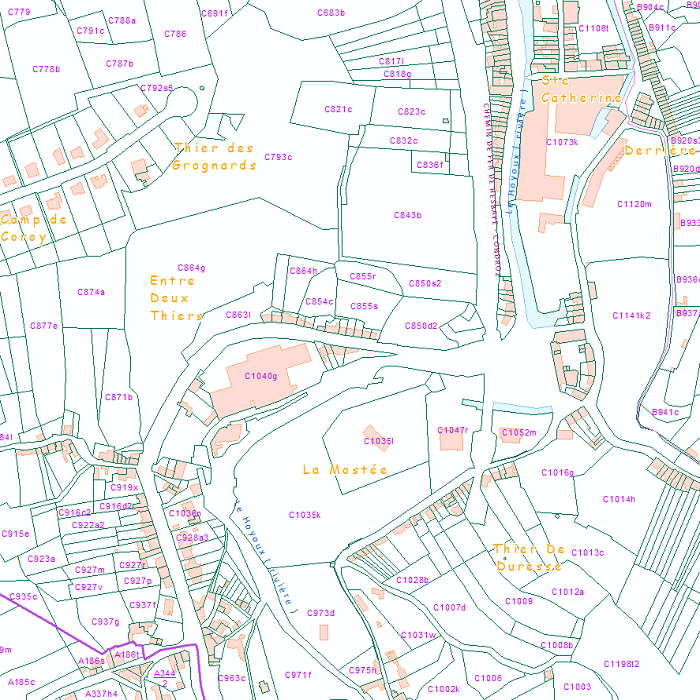
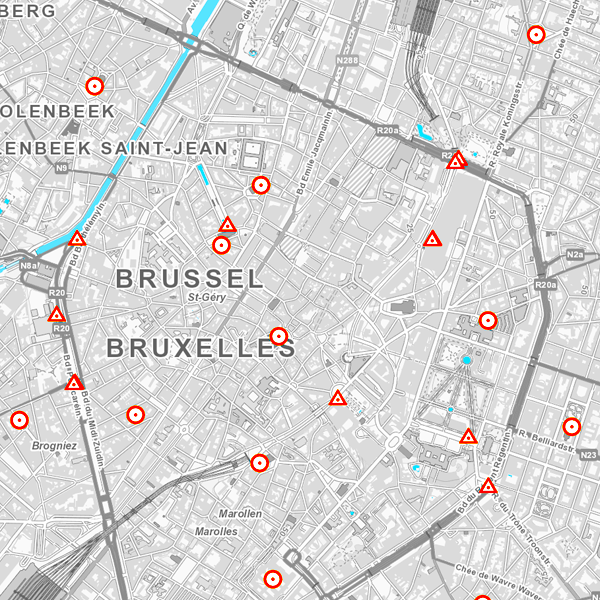
This web service provides the display of the datasets Administrative units - current situation and Land register plan - current situation. This webservice does not comply with the INSPIRE specifications, and the datasets to which it gives access do not comply with the INSPIRE specifications. This web service is available in several formats. It is recommended to use the PNG format.
-
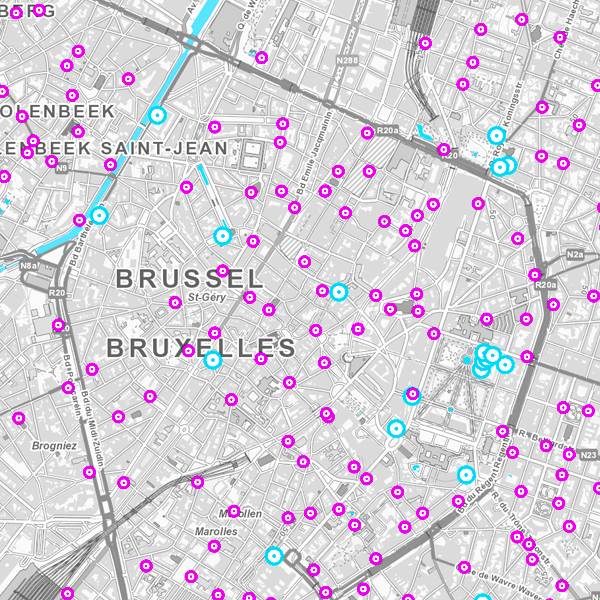
This web service provides the download per object of the datasets Administrative units - current situation and Land register plan - current situation. This webservice does not comply with the INSPIRE specifications, and the datasets to which it gives access do not comply with the INSPIRE specifications.
-
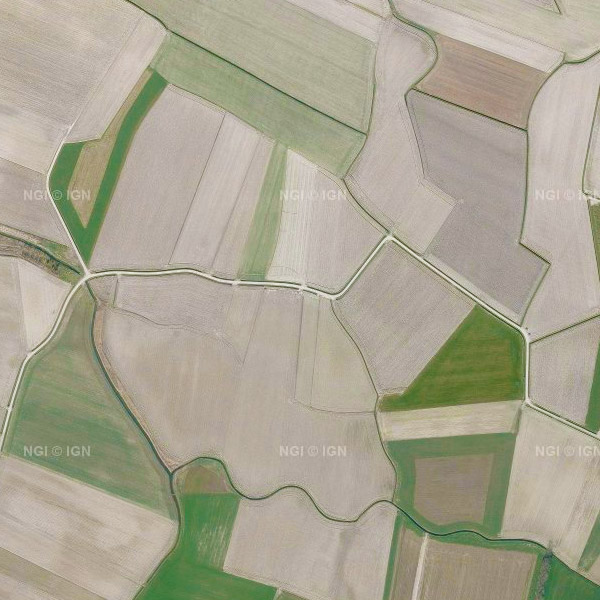
This service allows the visualization of the national orthophoto mosaics covering the entire territory of Belgium. The data is accessible via a Web Map Service (WMS). Orthophotos are aerial photographs that have been geometrically corrected (orthorectified) to eliminate distortions caused by terrain relief, lens distortion, and camera tilt. Unlike raw aerial imagery, orthophotos have a uniform scale and accurate geometry, making them suitable for cartography, measurements, and visual analysis. This specific service includes orthophotos from 2016 up to and including 2023, derived from aerial surveys carried out by the Belgian administrative Regions. A separate layer is published for each available year, with 2023 being the most recent orthophoto coverage in this service. The national orthophoto coverage is renewed annually. The orthophoto datasets of the Regions are integrated by the National Geographic Institute (NGI) into a single national coverage. Where possible, radiometric corrections are applied to ensure smooth transitions between the data of the Regions. The resulting orthophoto mosaics are georeferenced in the Lambert 2008 coordinate system. All orthophotos are in colour (RGB). For the 2016–2021 campaigns, the ground resolution (GSD) is 25 cm throughout Belgium. From the 2022 campaign onwards, the GSD is 25 cm in Wallonia and 15 cm in Flanders and the Brussels-Capital Region. The spatial coverage of this service is the entire Belgian territory. For downloading the most recent orthophoto mosaics, reference is made to the associated dataset "Orthofoto INSPIRE".
-
‘Top10Vector – Railway network’ is the dataset of the railway network in Belgium. This dataset includes 3 feature types, namely the railway track segments [RA_railwaytracksegment], railway stops [RA_railwaystop] and railway kilometer markers [RA_railwaykilometremarker]. The dataset can be downloaded via the links in 'Access' at the bottom of this page.
-
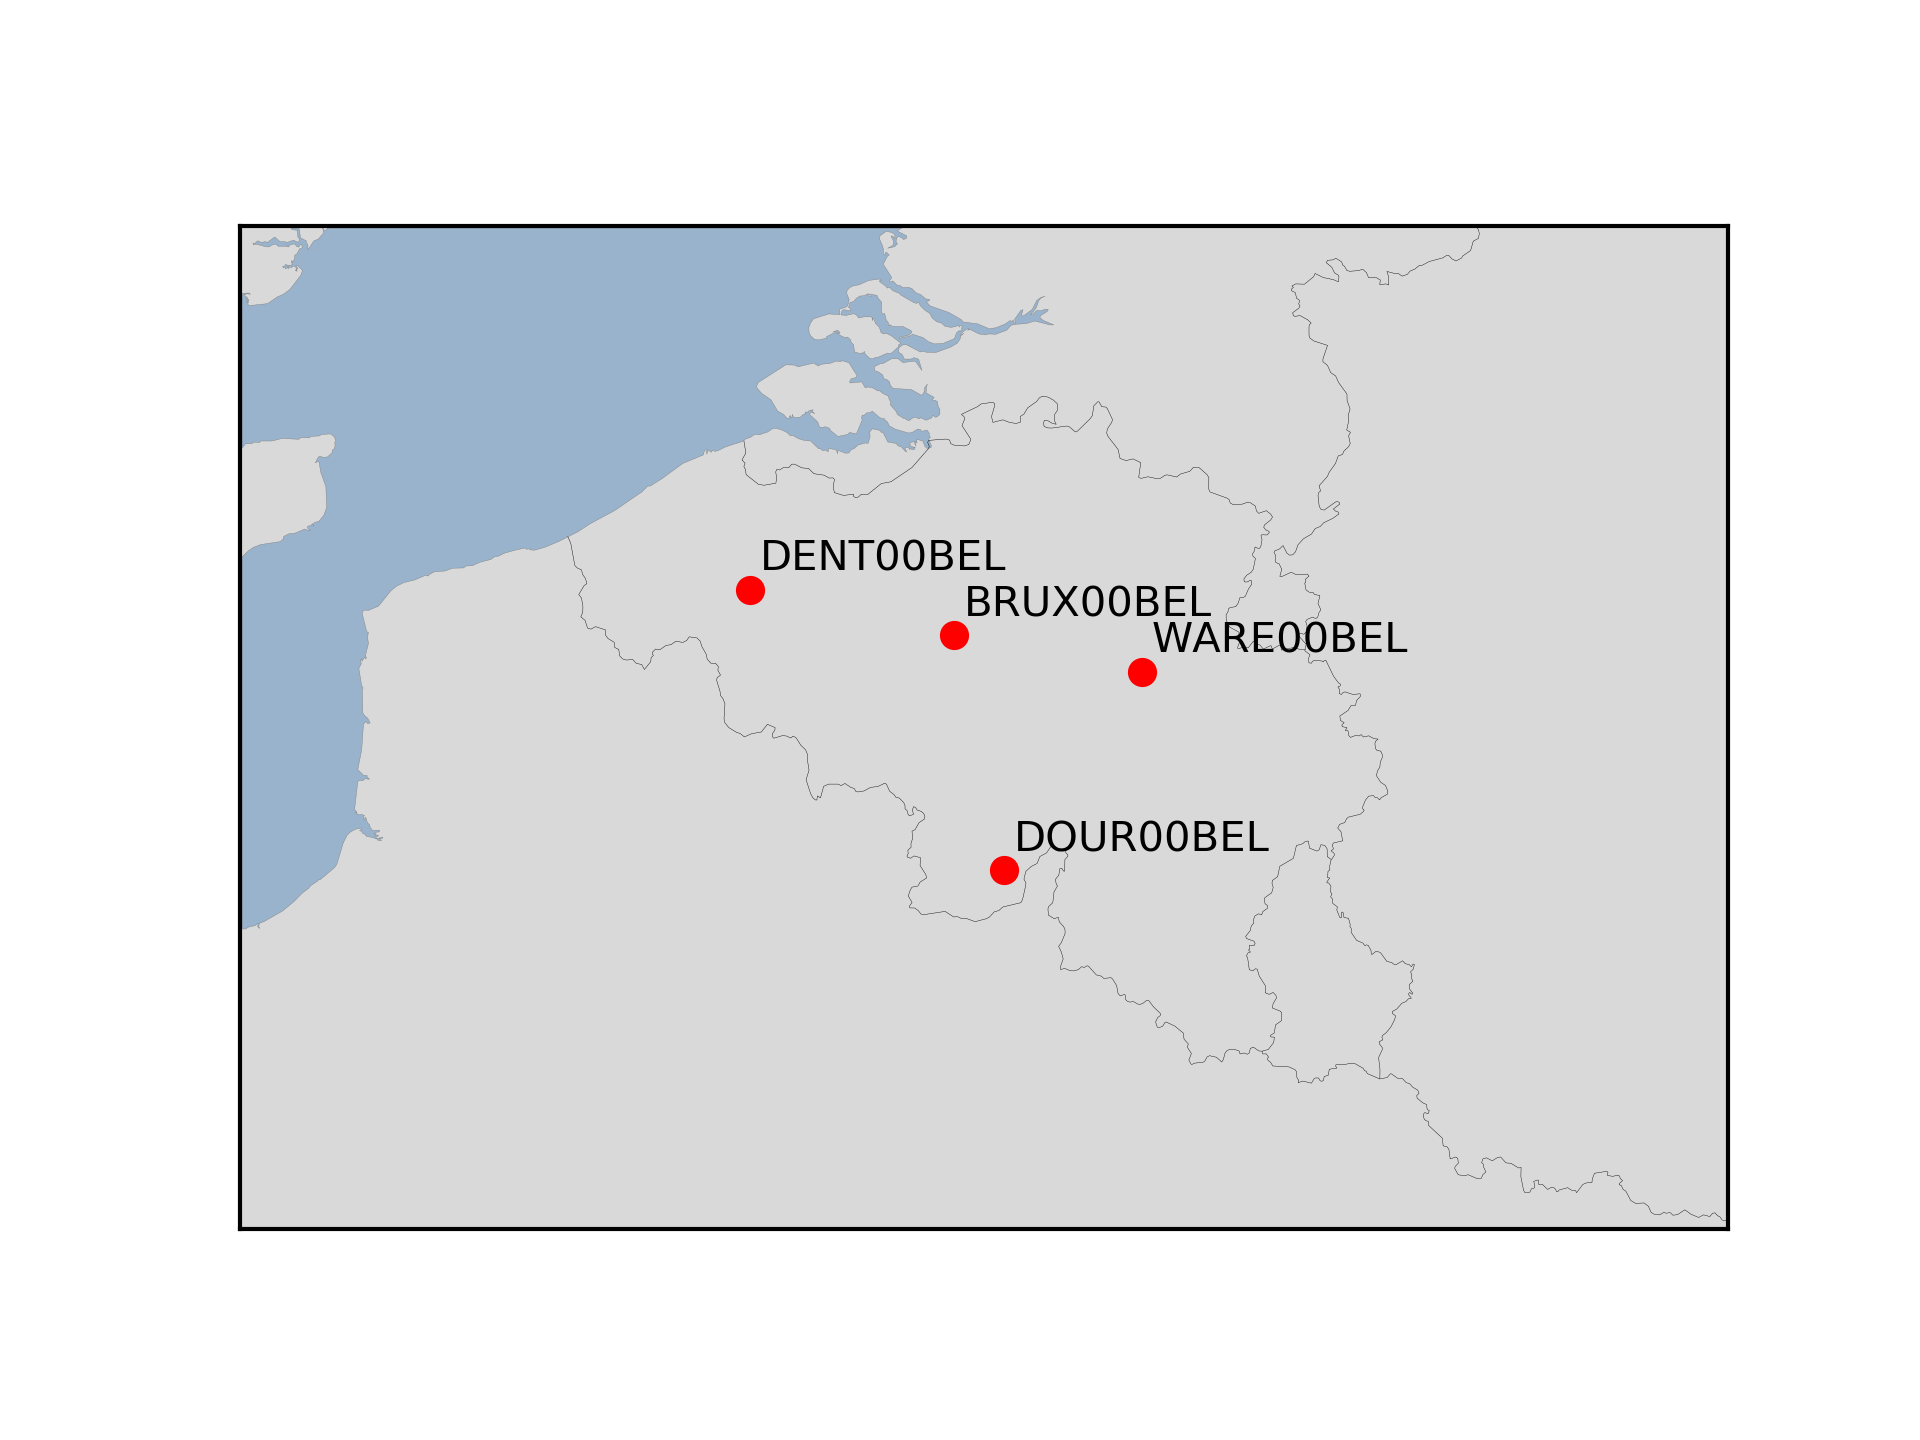
The Royal Observatory of Belgium maintains several continuously observing GNSS tracking stations in Belgium. The stations are also belonging to EUREF Permanent Network (EPN) used to maintain the ETRS89 and the observation data are available to the public through https://doi.org/10.24414/FST8-P256.