 geo.be Metadata Catalog
Royal Belgian Institute of Natural Sciences (RBINS)
Type of resources
Topics
INSPIRE themes
Keywords
Contact for the resource
Provided by
Years
Formats
Representation types
Scale
-
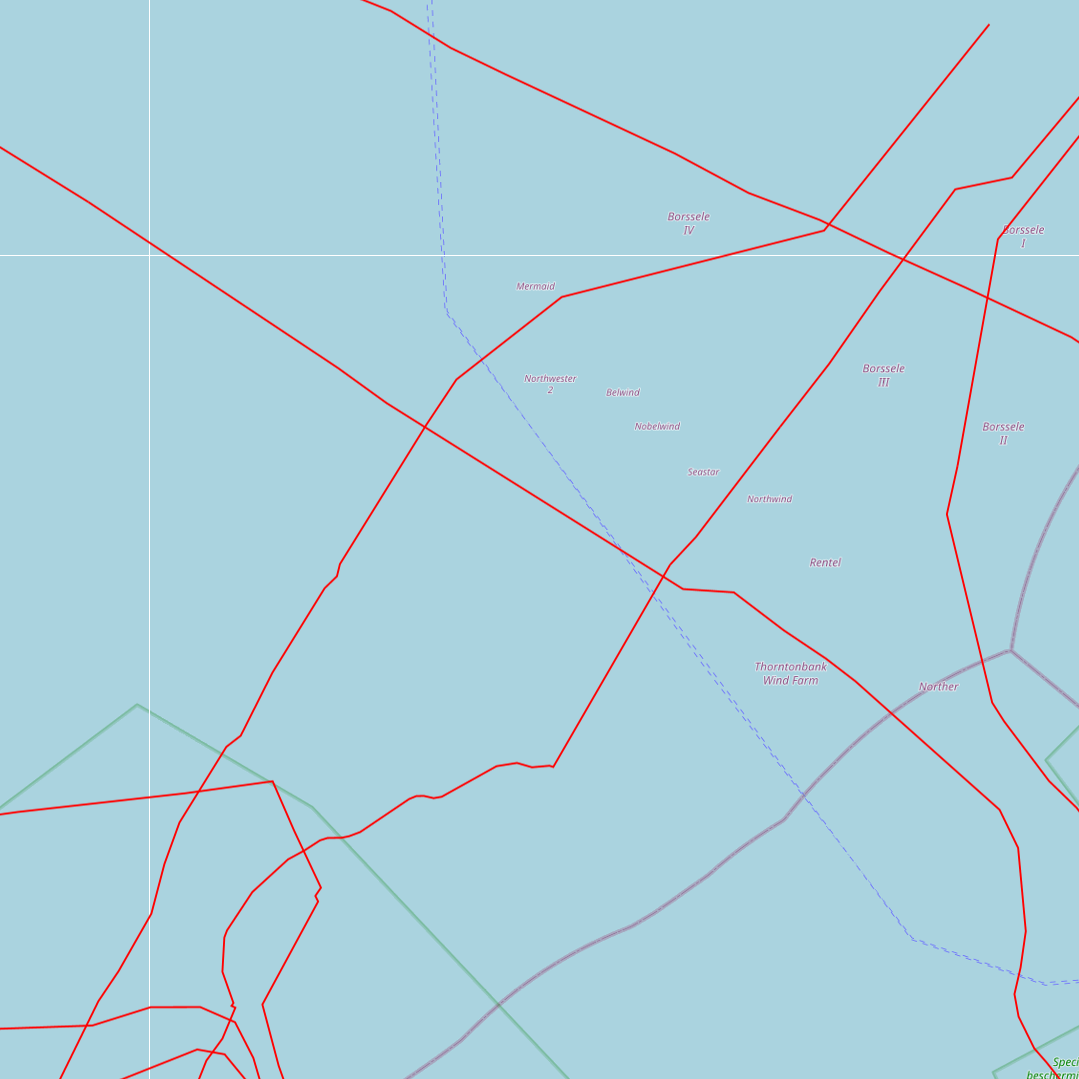
This dataset represents the exact location of active telecommunication cables (verified in 2010) installed in the Belgian Part of the North Sea.
-
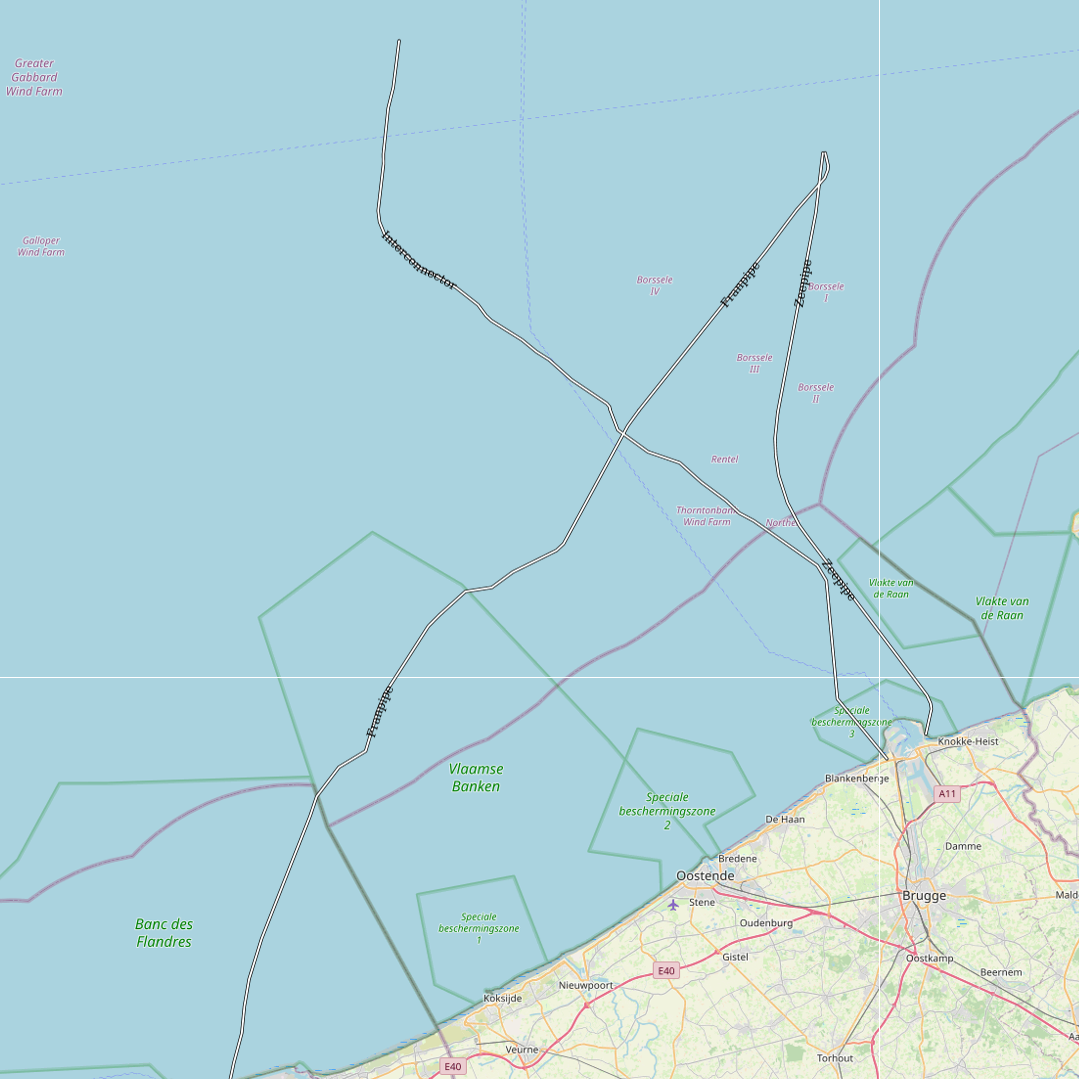
This dataset represents the exact location of gas pipelines installed in the Belgian Part of the North Sea.
-
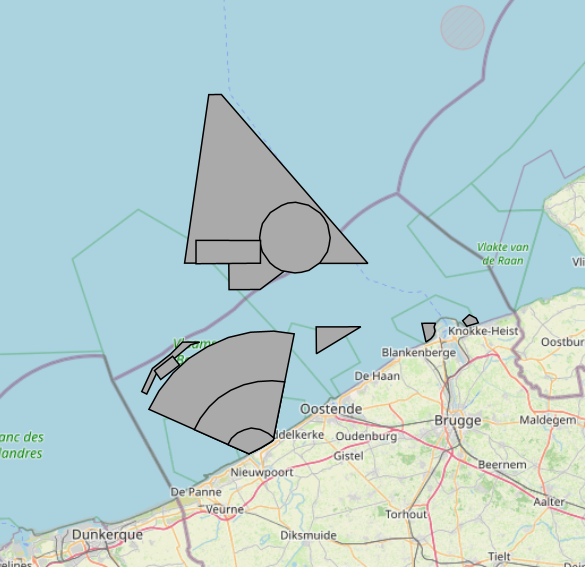
The Royal Decree of 20 March 2026 establishing the marine spatial plan for the period 2026 to 2034 in the Belgian marine areas defines 13 military use zones: Mine warfare exercise zone – QZR 040 (Art. 21§1.1°), Mine warfare exercise zone – NBH-10 (Wenduine) (Art. 21§1.2°), Mine warfare exercise zone – NB-01 (Westhinder) (Art. 21§1.3°), Mine warfare exercise zone (Buiten Ratel) (Art. 21§1.4°), Belgisch Nationaal Oefengebied voor Marineschepen (BNOM) (Art. 21§1.5°), Shallow Water Zone (Art. 21§1.6°), Zone for detonation exercises and operations (Art. 21§2), Lombardsijde firing sector: small sector (Art. 21§3.1°), Lombardsijde firing sector: middle sector (Art. 21§3.2°), Lombardsijde firing sector: large sector (Art. 21§3.3°), Paardenmarkt munitions disposal site (Art. 22§1). It replaces the 2020 Marine Spatial Plan. Please refer to the Belgian official gazette ("Moniteur belgeBelgisch Staatsblad") for official reference information.
-
UNDER EMBARGO - This dataset contains seasonal physiological measurements from controlled laboratory experiments on two dominant suspension-feeding species expected to colonise floating offshore structures: the blue mussel (Mytilus edulis; AphiaID 140480) and the wrinkled barnacle (Balanus crenatus; AphiaID 106215). The measured parameters include clearance rates, respiration rates, faecal pellet production rates, and faecal pellet sinking velocities. Mussels were collected from an aquaculture longline at the Westdiep SeaFarm, while barnacles were manually retrieved from the intertidal beachhead at Raversijde (Oostende, Belgium). All experiments were conducted using natural seawater collected from offshore sites in the Belgian part of the North Sea. Measurements were repeated across multiple seasons to capture temporal variability in physiological performance. The dataset was produced within the SWiM and EcoMPV projects and is suitable for reuse in ecosystem and biogeochemical modelling, including simulations of phytoplankton dynamics associated with large-scale offshore marine photovoltaic (MPV) developments.
-
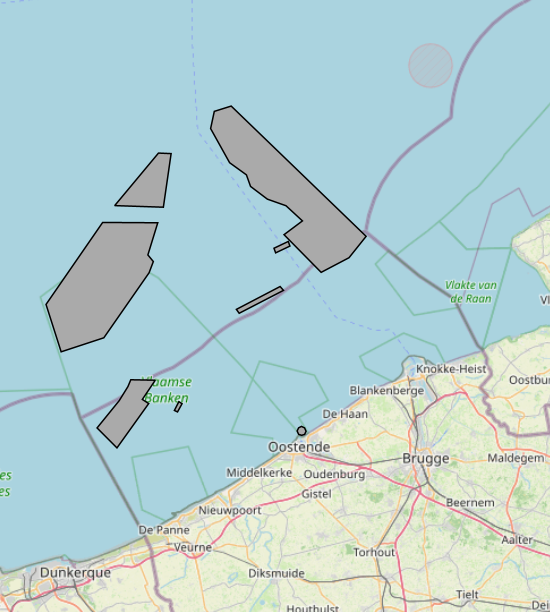
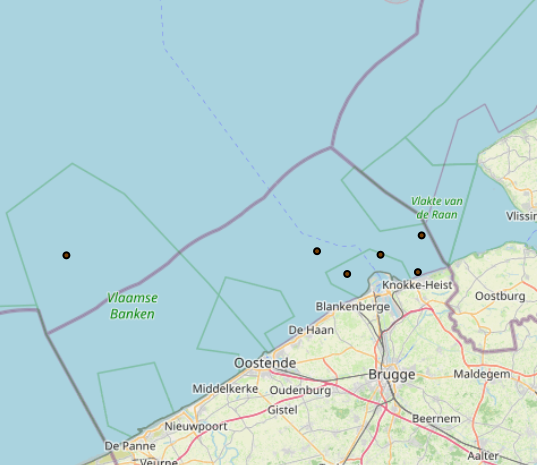
The Royal Decree of 20 March 2026 establishing the marine spatial plan for the period 2026 to 2034 in the Belgian marine areas defines 8 scientific research and recreation zones: Thorntonbank monitoring area (Art. 23§10.1°), Gootebank monitoring area (Art. 23§10.2°), Scientific research zone (Art. 23§3), Search area for scientific research reserve (Art. 23§6), Zone with prohibition of additional fixed structures (Art. 23§7.4°), Zone accessible for scientific research 1 (Art. 23§8.1°), Zone accessible for scientific research 2 (Art. 23§8.1°), Reference area for calibration and quality assessment of measuring instruments (Art. 23§9). It replaces the 2020 Marine Spatial Plan. Please refer to the Belgian official gazette ("Moniteur belgeBelgisch Staatsblad") for official reference information.
-
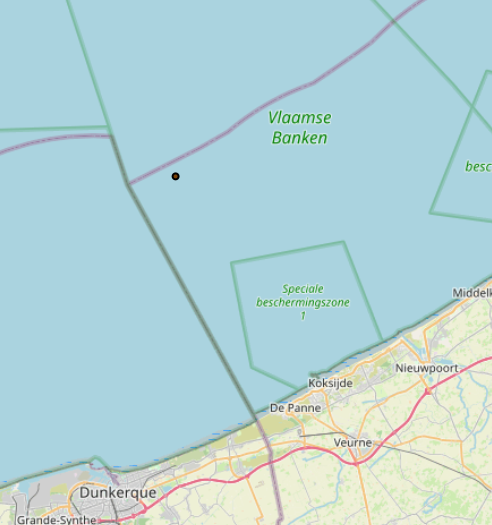
The Royal Decree of 20 March 2026 establishing the marine spatial plan for the period 2026 to 2034 in the Belgian marine areas defines 1 radar tower: Oostdyck radar tower (Art. 25§3). It replaces the 2020 Marine Spatial Plan. Please refer to the Belgian official gazette ("Moniteur belgeBelgisch Staatsblad") for official reference information.
-
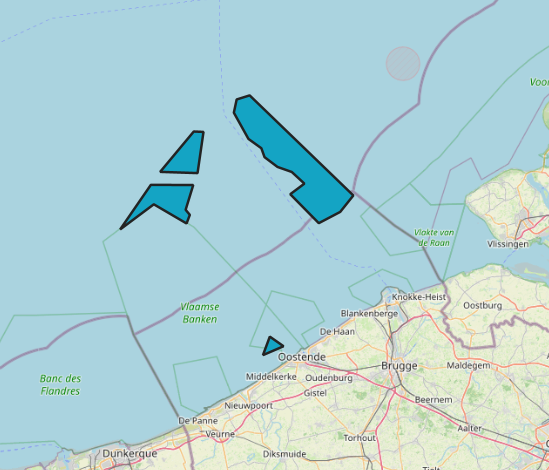
The Royal Decree of 20 March 2026 establishing the marine spatial plan for the period 2026 to 2034 in the Belgian marine areas defines 3 aquaculture zones: Fisheries research zone (Art. 17§2), Zone accessible to aquaculture and passive fisheries (Art. 18), Zone accessible to aquaculture (Art. 18§1). It replaces the 2020 Marine Spatial Plan. Please refer to the Belgian official gazette ("Moniteur belgeBelgisch Staatsblad") for official reference information.
-
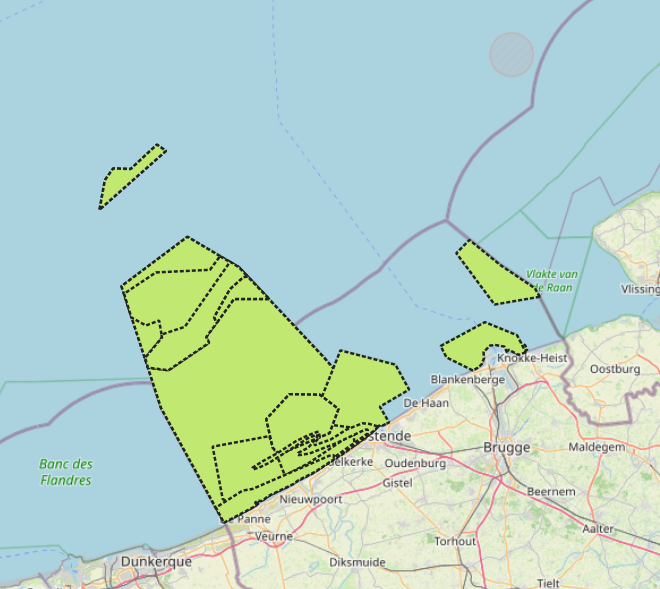
The Royal Decree of 20 March 2026 establishing the marine spatial plan for the period 2026 to 2034 in the Belgian marine areas defines 13 nature conservation areas: Seabed integrity zone: Zone 1, upper (Art. 10§1.1°), Seabed integrity zone: Zone 2, middle (Art. 10§1.2°), Seabed integrity zone: Zone 3, lower (Art. 10§1.3°), Ramsar area (Art. 11), Special Area of Conservation "Vlaamse Banken" (Art. 8§1), Special Area of Conservation "Vlakte van de Raan" (Art. 8§3), Special Protection Area for Birds: SPA 1 (Art. 8§5.1°), Special Protection Area for Birds: SPA 2 (Art. 8§5.2°), Special Protection Area for Birds: SPA 3 (Art. 8§5.3°), Marine reserve: Zone 1, upper (Art. 9§1.1°), Marine reserve: Zone 2a, middle (Art. 9§1.2°), Marine reserve: Zone 2b, middle (Art. 9§2), Marine reserve: Zone 3, lower (Art. 9§3). It replaces the 2020 Marine Spatial Plan. Please refer to the Belgian official gazette ("Moniteur belgeBelgisch Staatsblad") for official reference information.
-
The Royal Decree of 20 March 2026 establishing the marine spatial plan for the period 2026 to 2034 in the Belgian marine areas defines 1 measuring pole: Measurement poles (Art. 25§2). It replaces the 2020 Marine Spatial Plan. Please refer to the Belgian official gazette ("Moniteur belgeBelgisch Staatsblad") for official reference information.
-
2019 Belgian MSP - Princess Elizabeth Zone for renewable Energy in the Belgian Part of the North Sea
This dataset represents the location of the Princess Elizabeth zone in the Belgian Part of the North Sea as described in the Royal Decree of May 22th, 2019, establishing a marine spatial plan for the period 2020-2026. Art. 8. § 3.