 geo.be Metadata Catalog
Royal Meteorological Institute of Belgium
Type of resources
Available actions
Topics
INSPIRE themes
Keywords
Contact for the resource
Provided by
Years
Formats
Representation types
Update frequencies
status
Service types
Resolution
-
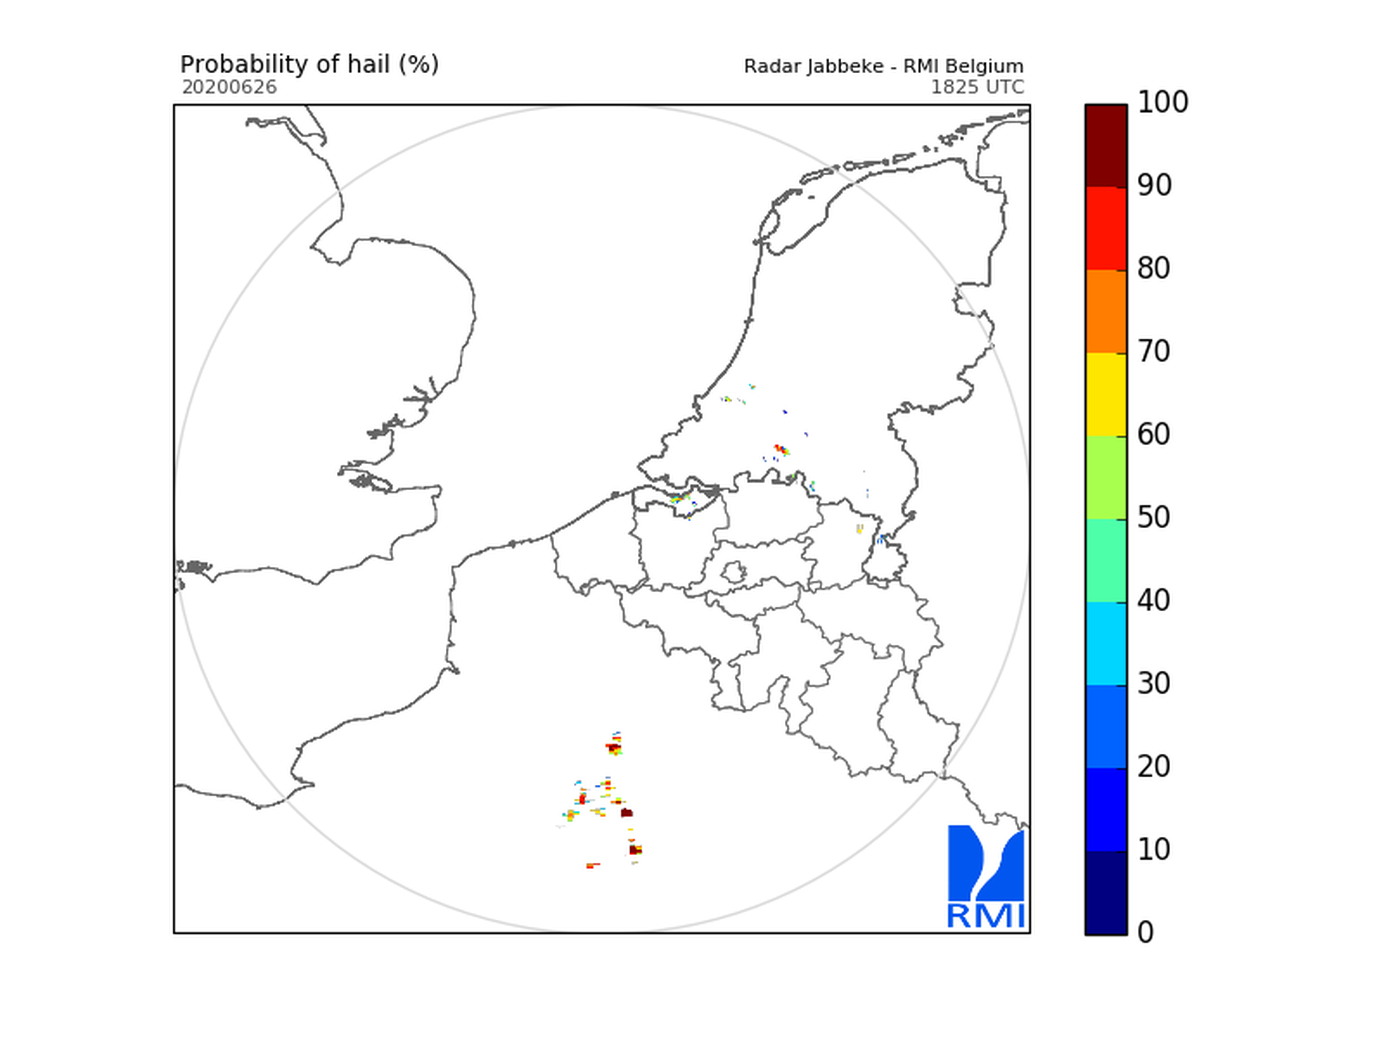
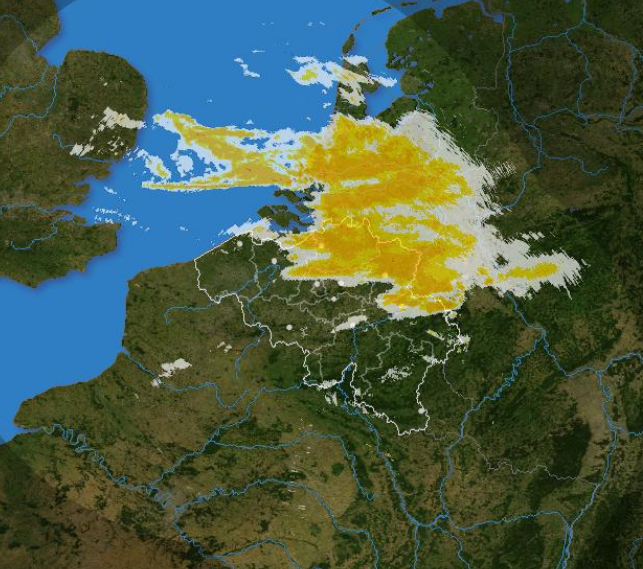
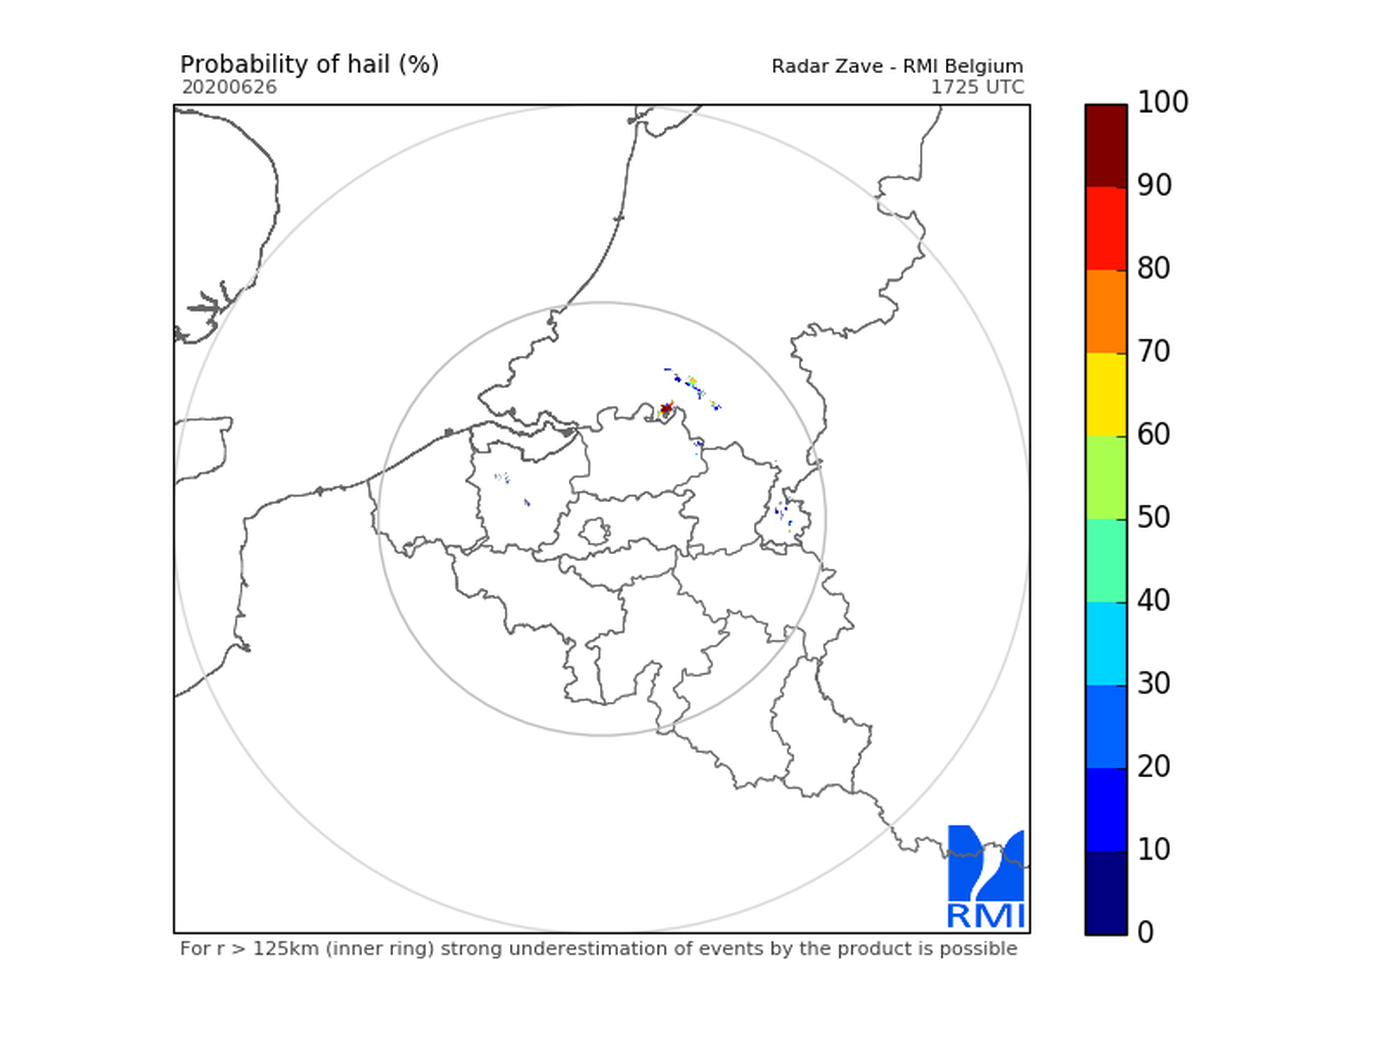
Hail products are derived from the observed vertical profiles of radar reflectivity and the NWP vertical profiles of temperature. Three types of products are generated. poh : probability of hail of any size (larger than 0.5 cm diameter)expressed in %. posh : probability of severe hail(larger than 2cm)expressed in %. mesh : maximum expected size of hailexpressed in mm of hailstone diameter. All products are generated every 5 minutes. This product is not publically available yet.
-
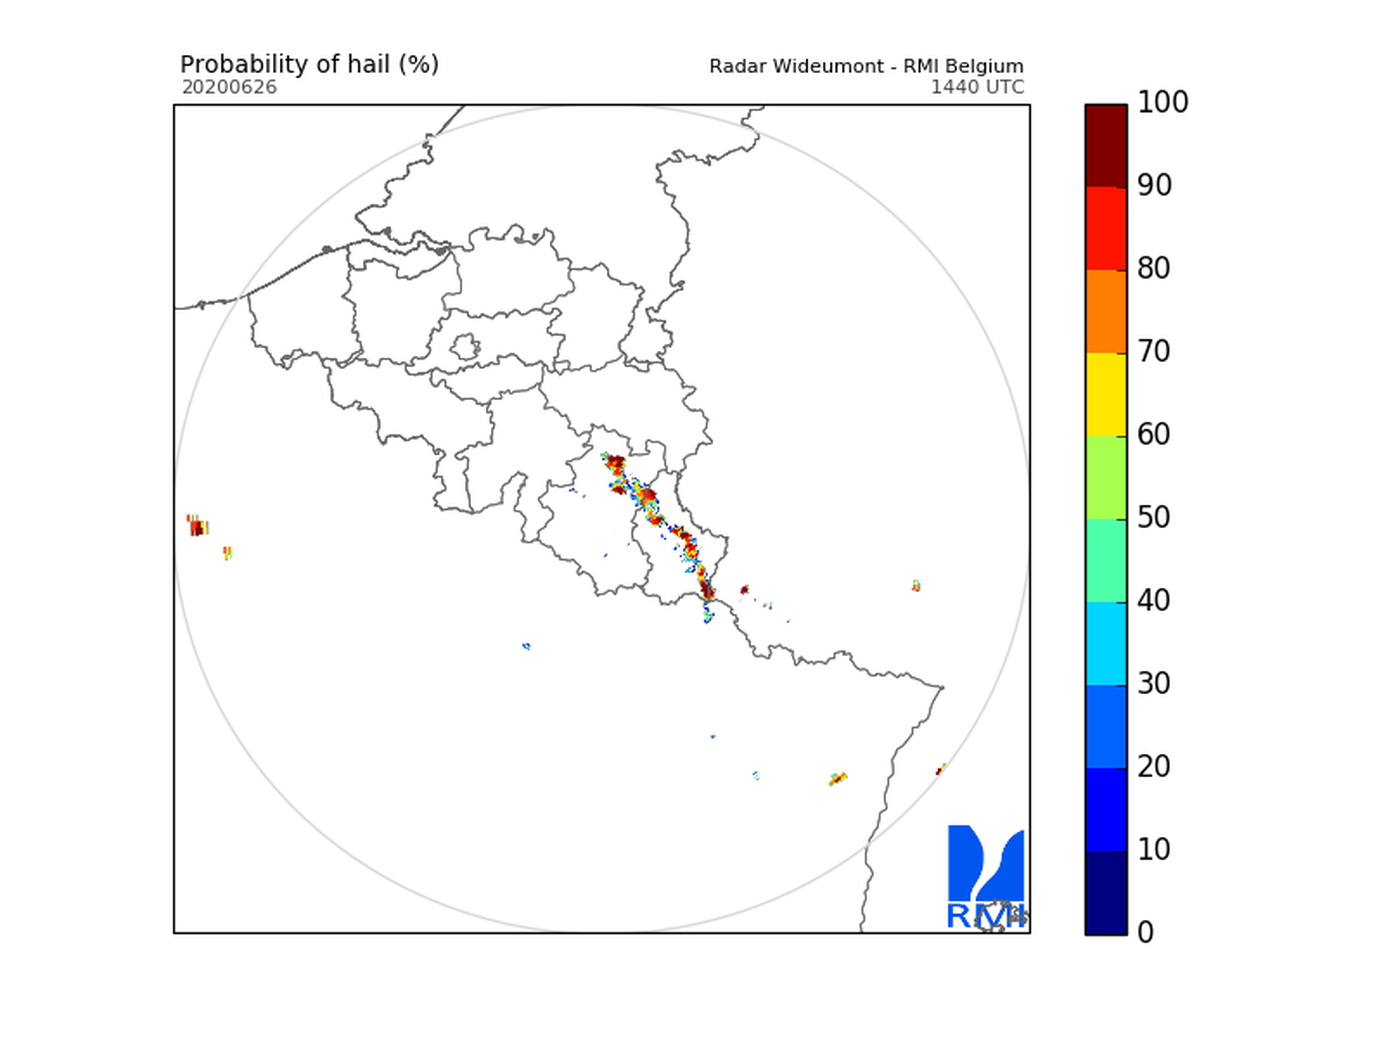
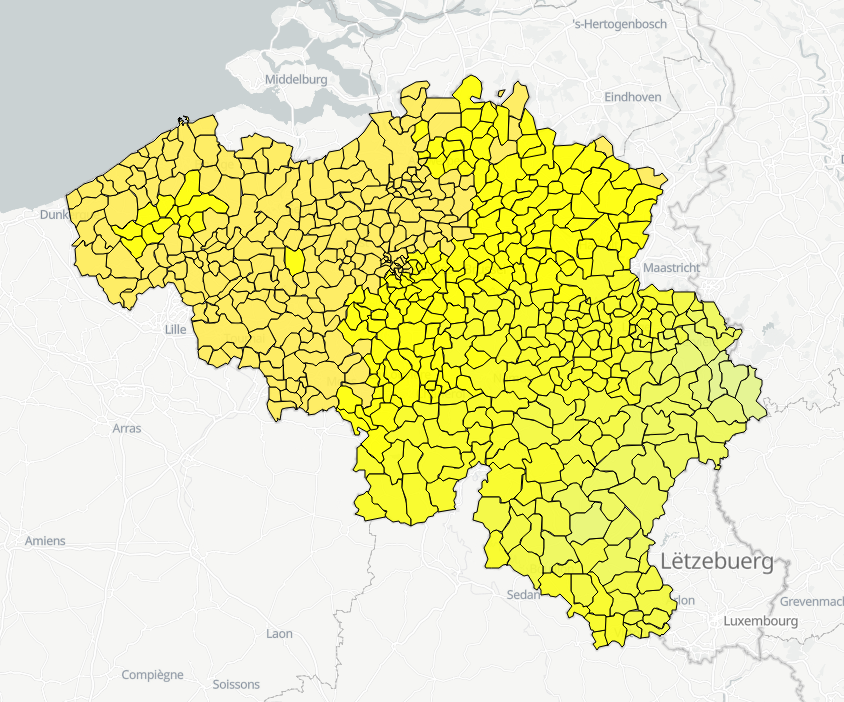
Hourly forecasts for each belgian commune, from current hour up to the next 5 days. This product is not publically available.
-
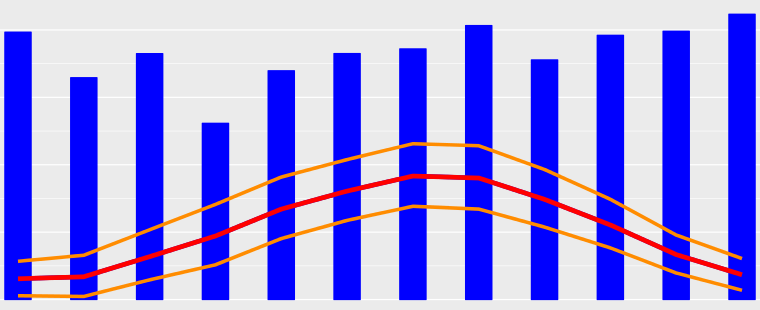
A climate normal is an average over a 30-years period. The period 1981-2010 is the current reference period recommended by the World Meteorological Organization (WMO). Recent climate normals are available for any locations in Belgium and several parameters including air temperature, precipitations and solar radiation. Climate normals for the reference period 1981-2010 are available for air temperature, precipitation and derived parameters (e.g., annual number of summer days, annual number of precipitation days, etc.). For solar radiation, the reference period had to be adjusted to 1984-2013 because of data availability. These climate normals are available as maps and as table for each Belgian municipality.
-
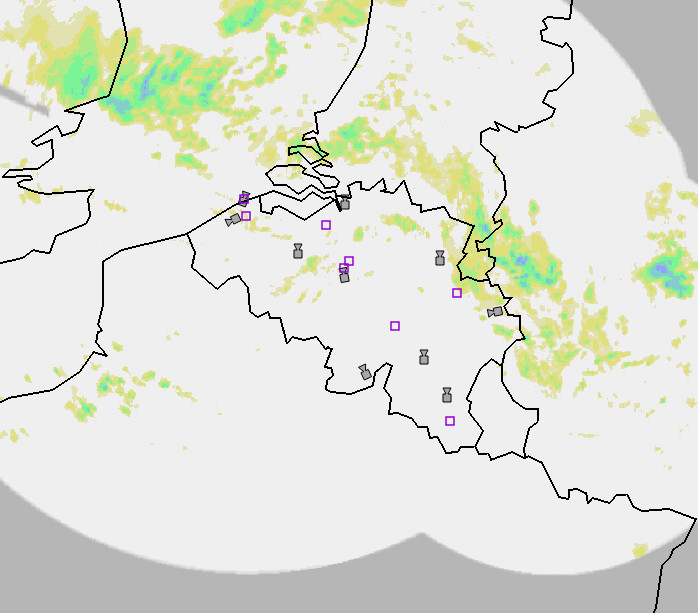
The composite is produced every 5 minutes using the reflectivity data from the Wideumont and Jabbeke weather radars. This product is not publicly available yet.
-
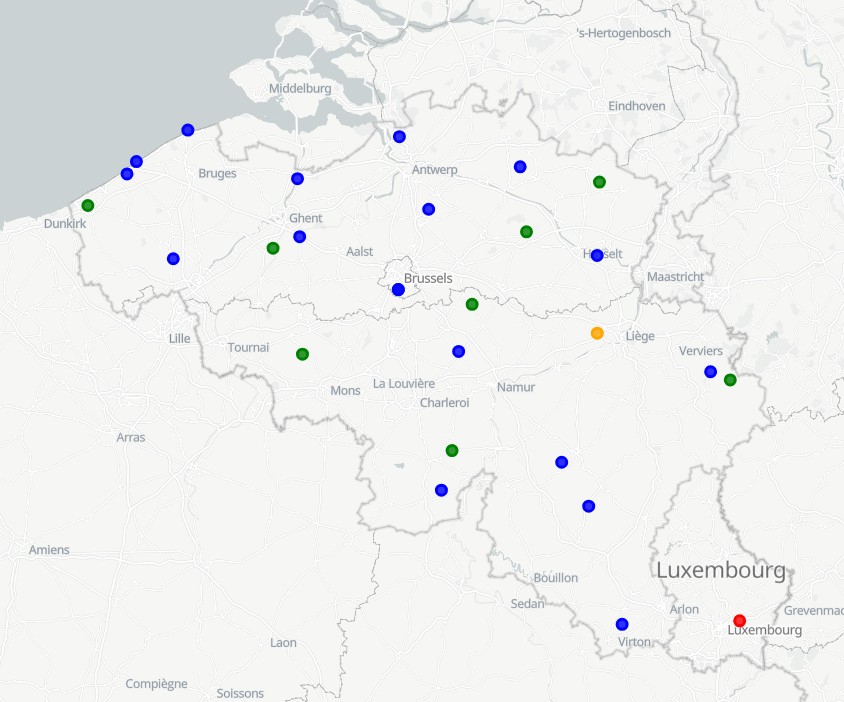
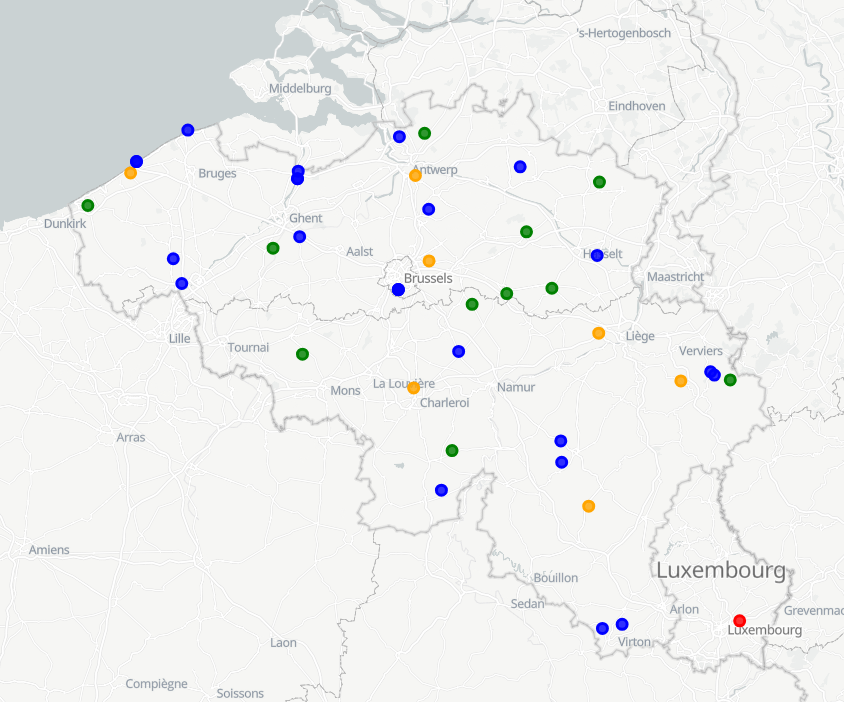
View Service (WMS) for Automatic weather station (AWS) observations
-
Weather model INCA. Available parameters : 2m Temperature, 2m Dewpoint, 2m Relative Humidity, Snowfall level, Freezing level, 3D Temperature, 3D Humidity, 3D Wind, 10m Wind, 10m Gusts, Ground temperature, Wind chill, Precipitation, Precipitation type, Lightning, Collection of convective analysis fields:CAPE, CIN, LCL, Level of free convection,Lifted Index, Showalter Index, Deep ConvectionIndex, Trigger temperature, Trigger temperaturedeficit, Equivalent Pot. temperature, Moistureconvergence, Flow divergence, Precipitable water, Cloudiness, Visibility. This product is not publicly available yet
-
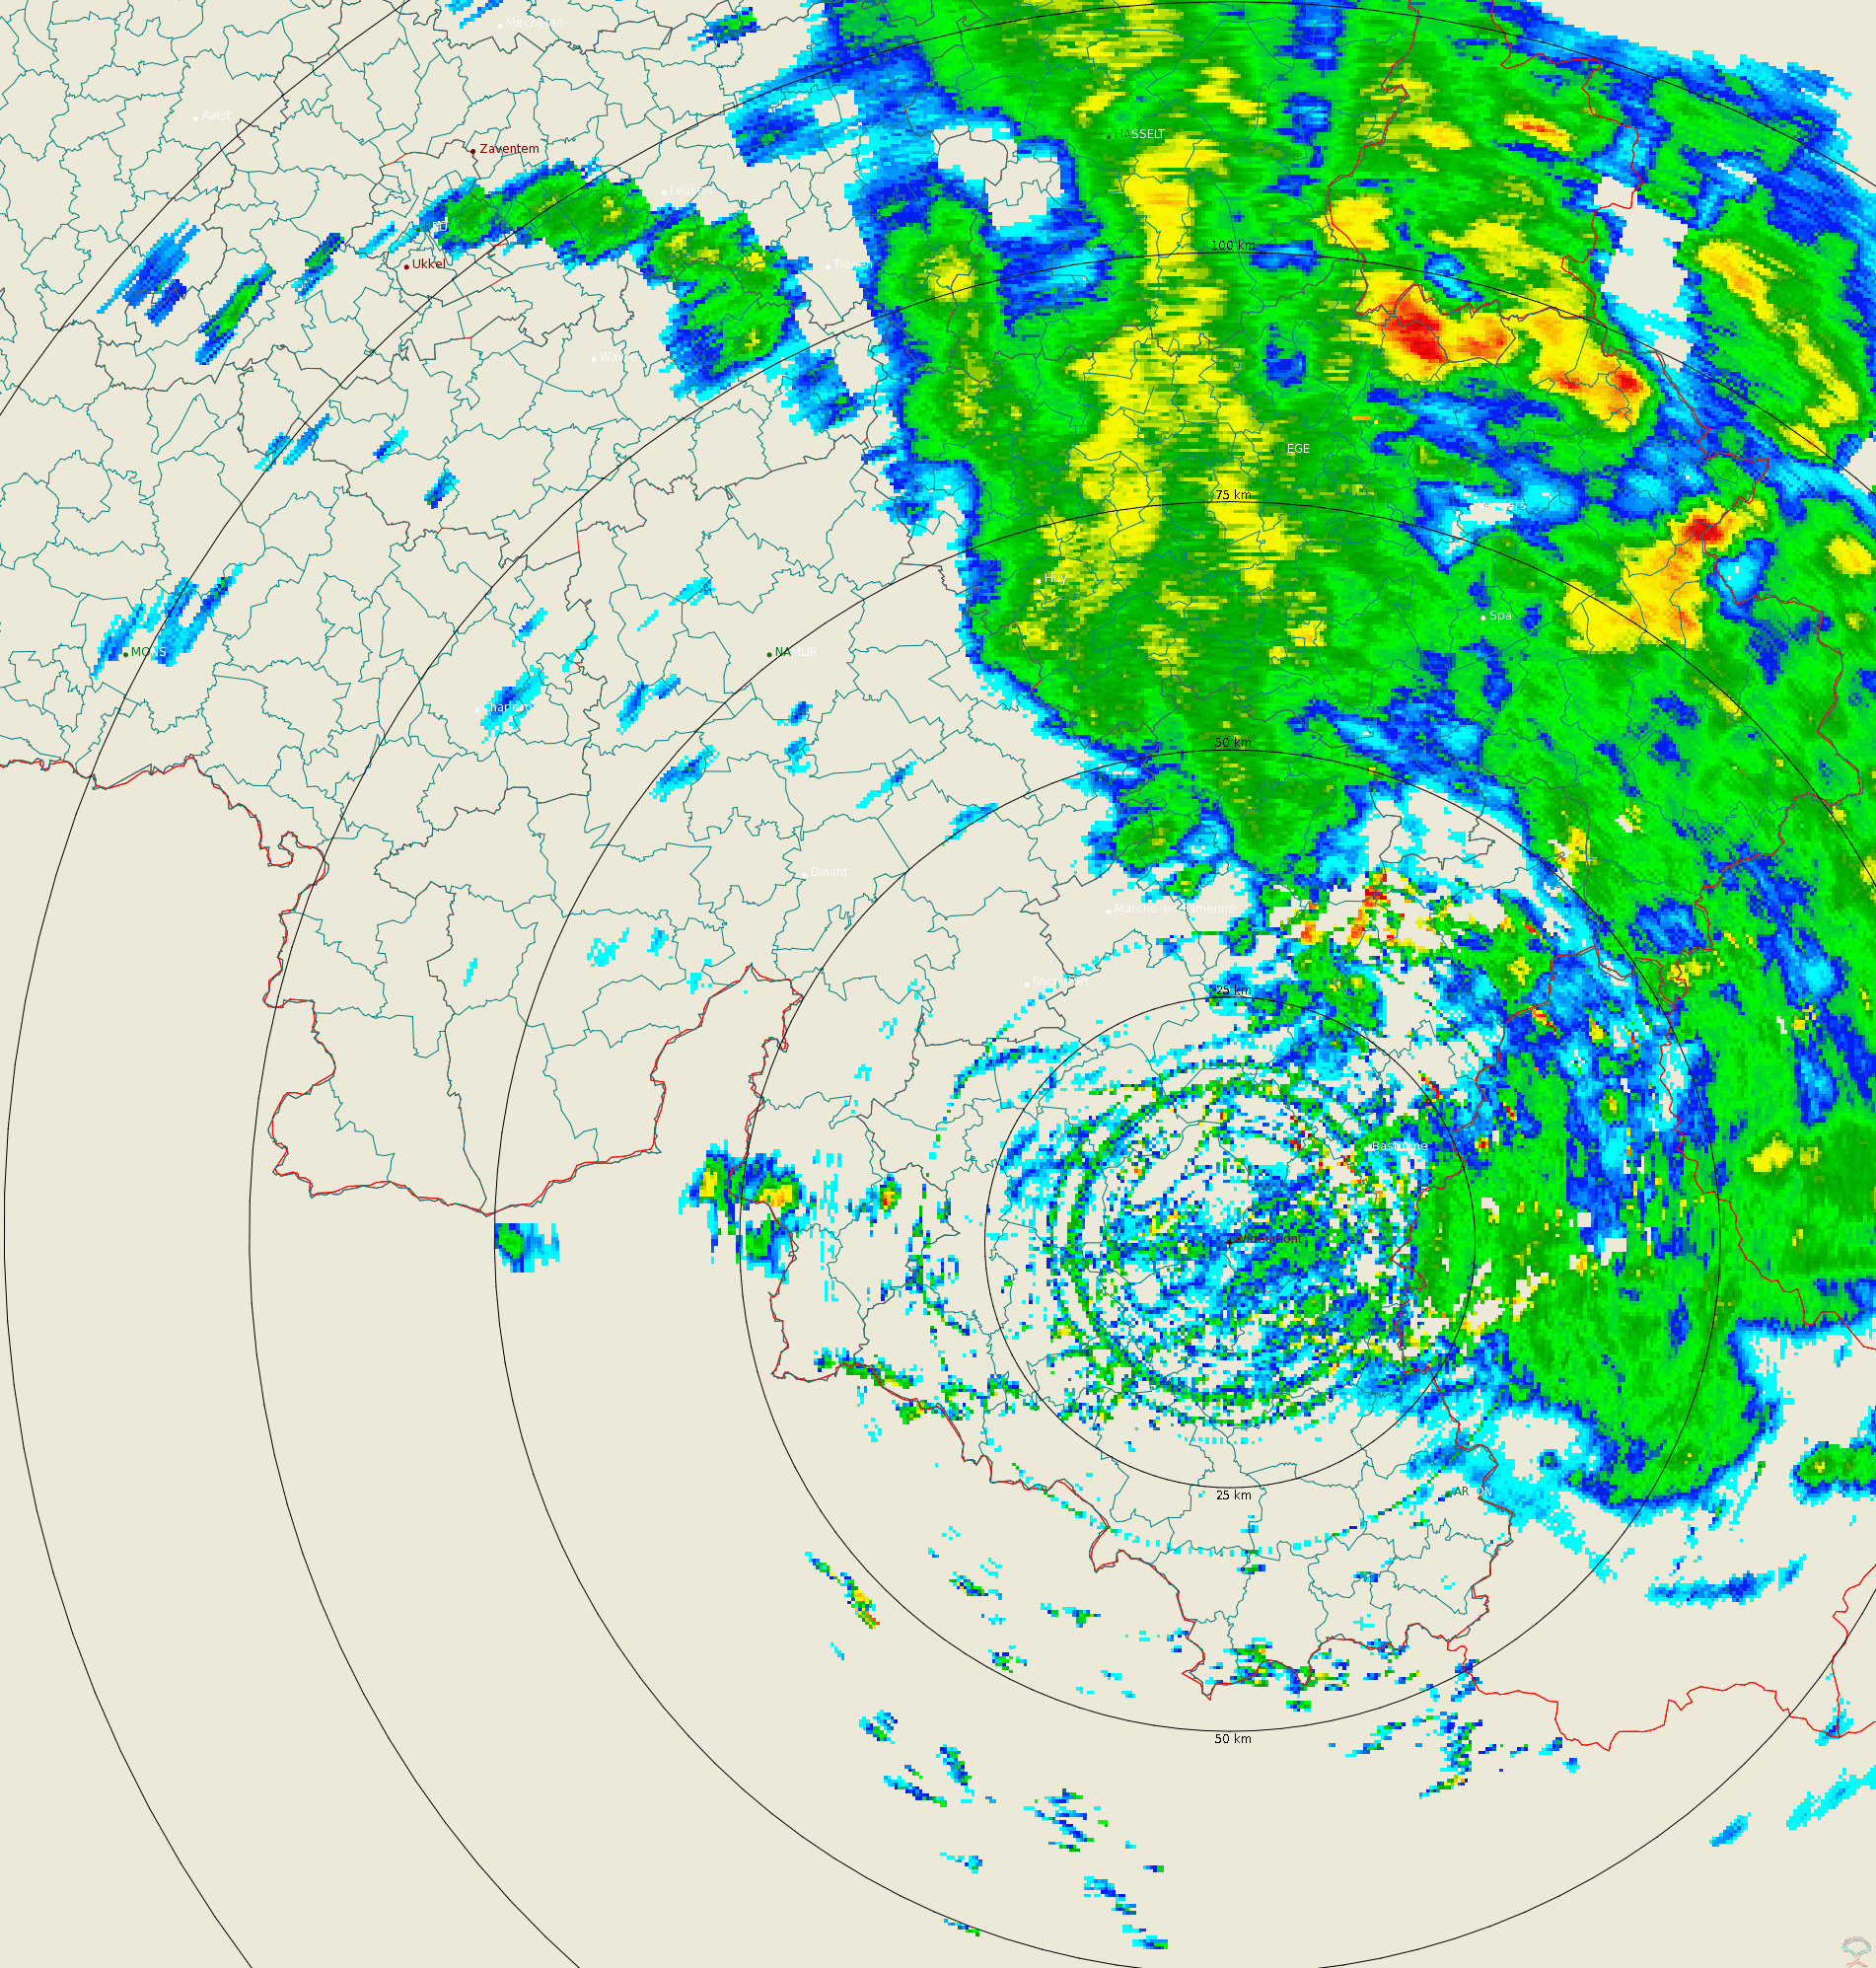
Polar volume reflectivity data from the Wideumont weather radar. Volume data files are produced every 5 minutes from a multiple elevation scan. This product is not publicly available yet.
-
Hail products are derived from the observed vertical profiles of radar reflectivity and the NWP vertical profiles of temperature. Three types of products are generated. poh : probability of hail of any size (larger than 0.5 cm diameter)expressed in %. posh : probability of severe hail(larger than 2cm)expressed in %. mesh : maximum expected size of hailexpressed in mm of hailstone diameter. All products are generated every 5 minutes. This product is not publically available yet.
-
View Service (WMS) for Synoptic observations