 geo.be Metadata Catalog
climatologyMeteorologyAtmosphere
Type of resources
Available actions
Topics
INSPIRE themes
federalThemes
Keywords
Contact for the resource
Provided by
Years
Formats
Representation types
Update frequencies
status
Scale
Resolution
-
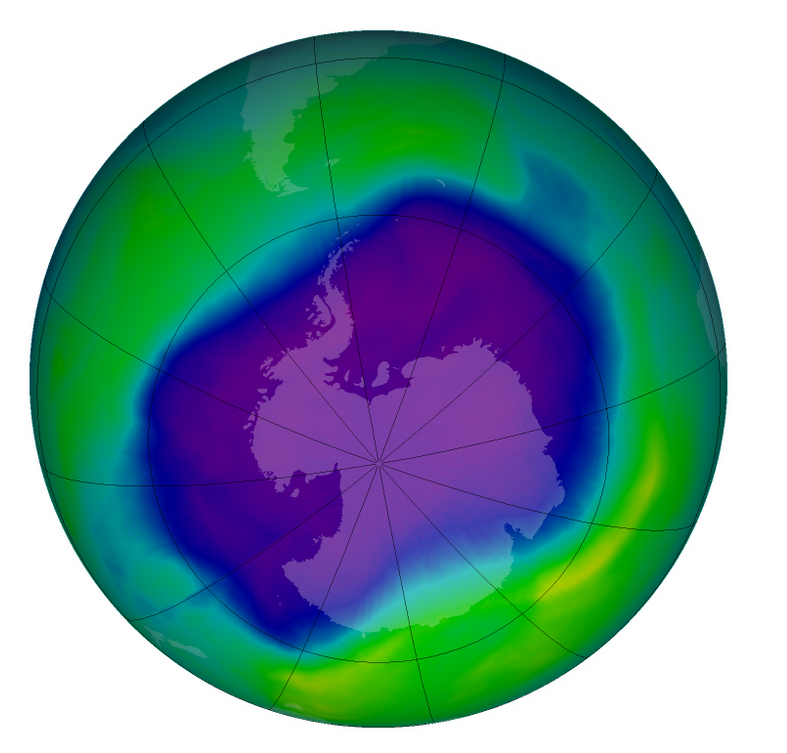
From multiple observations during the day with UV spectrophotometers a daily value of the ozone column is calculated. This product is not publically available yet.
-
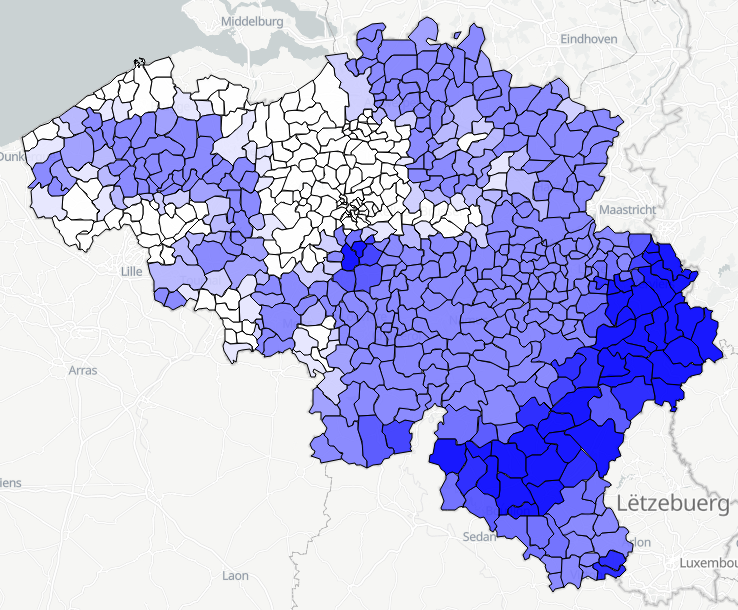
Daily forecasts for each Belgian commune, from current day up to the next 14 days. Available parameters are : min temperature, max temperature, weather type, wind speed, wind direction, maximum hust speed, quantity of precipitation. This product is not publicly available.
-
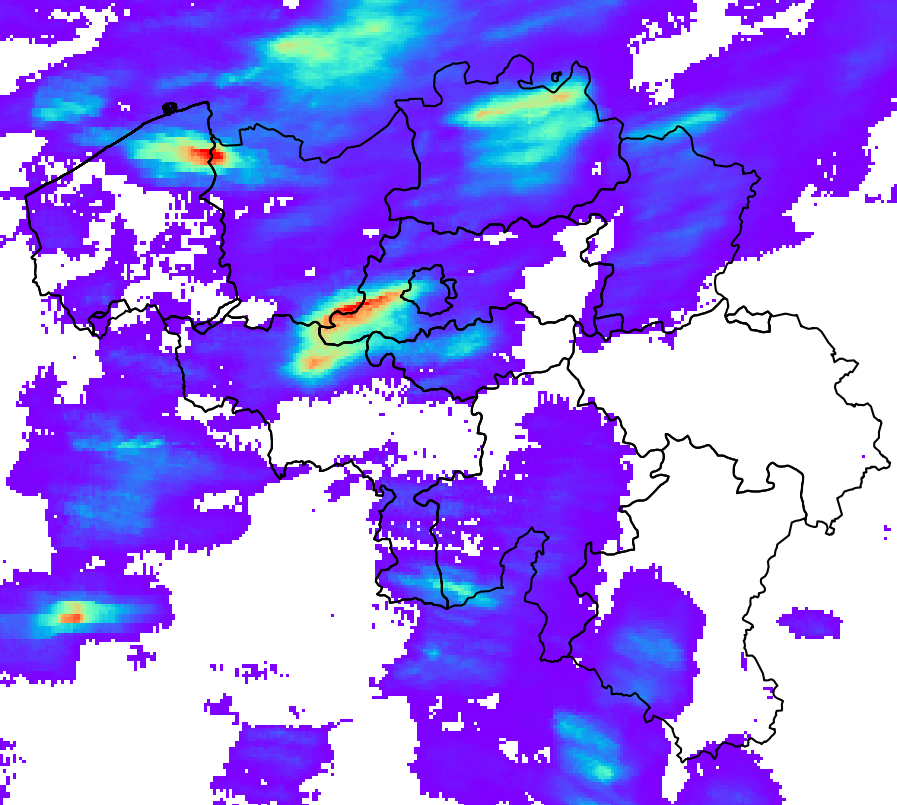
RADQPE provides high resolution radar-based quantitative precipitation estimation in realtime for Belgium and its surroundings. This product is not publically available yet.
-
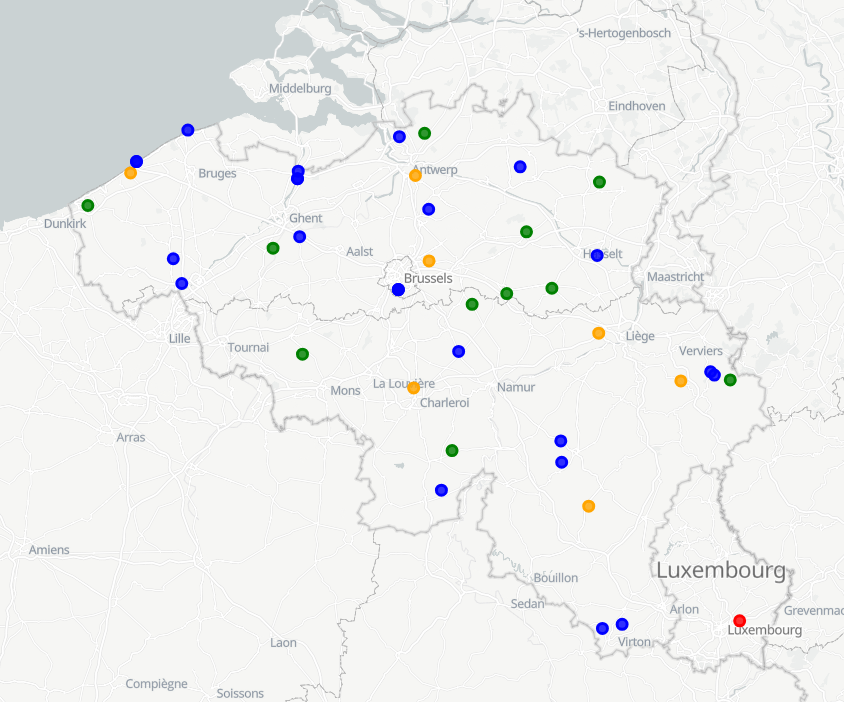
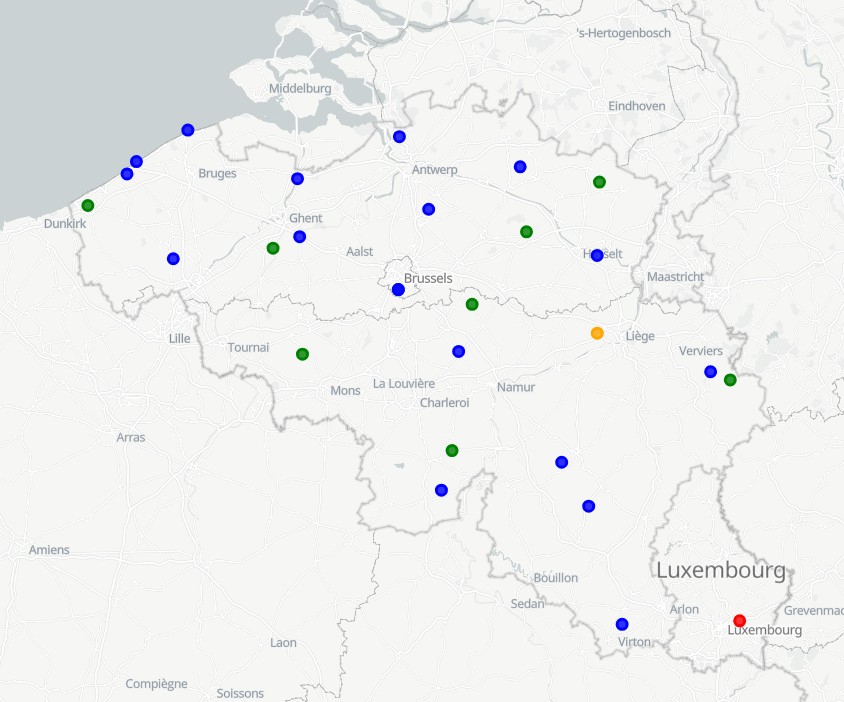
The SYNOP data of RMI contain the observations of the synoptic network, currently consisting of 29 stations, 13 of which are owned by RMI. The other stations belong to MeteoWing (8 stations), Skeyes (7 stations). There is also 1 foreign station. All SYNOP data is given in Universal Time! (local time winter = UT +1; local time summer = UT + 2) Parameters: 1. Precipitation: PRECIP_QUANTITY + PRECIP_RANGE 2. Temperature: TEMP + TEMP_MIN + TEMP_MAX + TEMP_GRASS_MIN 3. Wind: WIND_SPEED + WIND_SPEED_UNIT + WIND_DIRECTION + WIND_PEAK_SPEED 4. relative humidity: HUMIDITY_RELATIVE 5. weather type: WEATHER_CURRENT 6. air pressure: PRESSURE of PRESSURE_STATION_LEVEL 7. sunshine duration: SUN_DURATION_24H 8. Global radiation: SHORT_WAVE_FROM_SKY_24HOUR 9. Total cloudiness: CLOUDINESS
-
The ceilometer CL51 employs a pulsed diode laser LIDAR technology, where short, powerful laser pulses are sent out in a vertical or near-vertical direction. The reflection of light (backscatter) caused by clouds, precipitation or other obscuration is analysed and used to determine the cloud base height, the cloud layer height and the amount of clouds (in octas) in different layers.
-
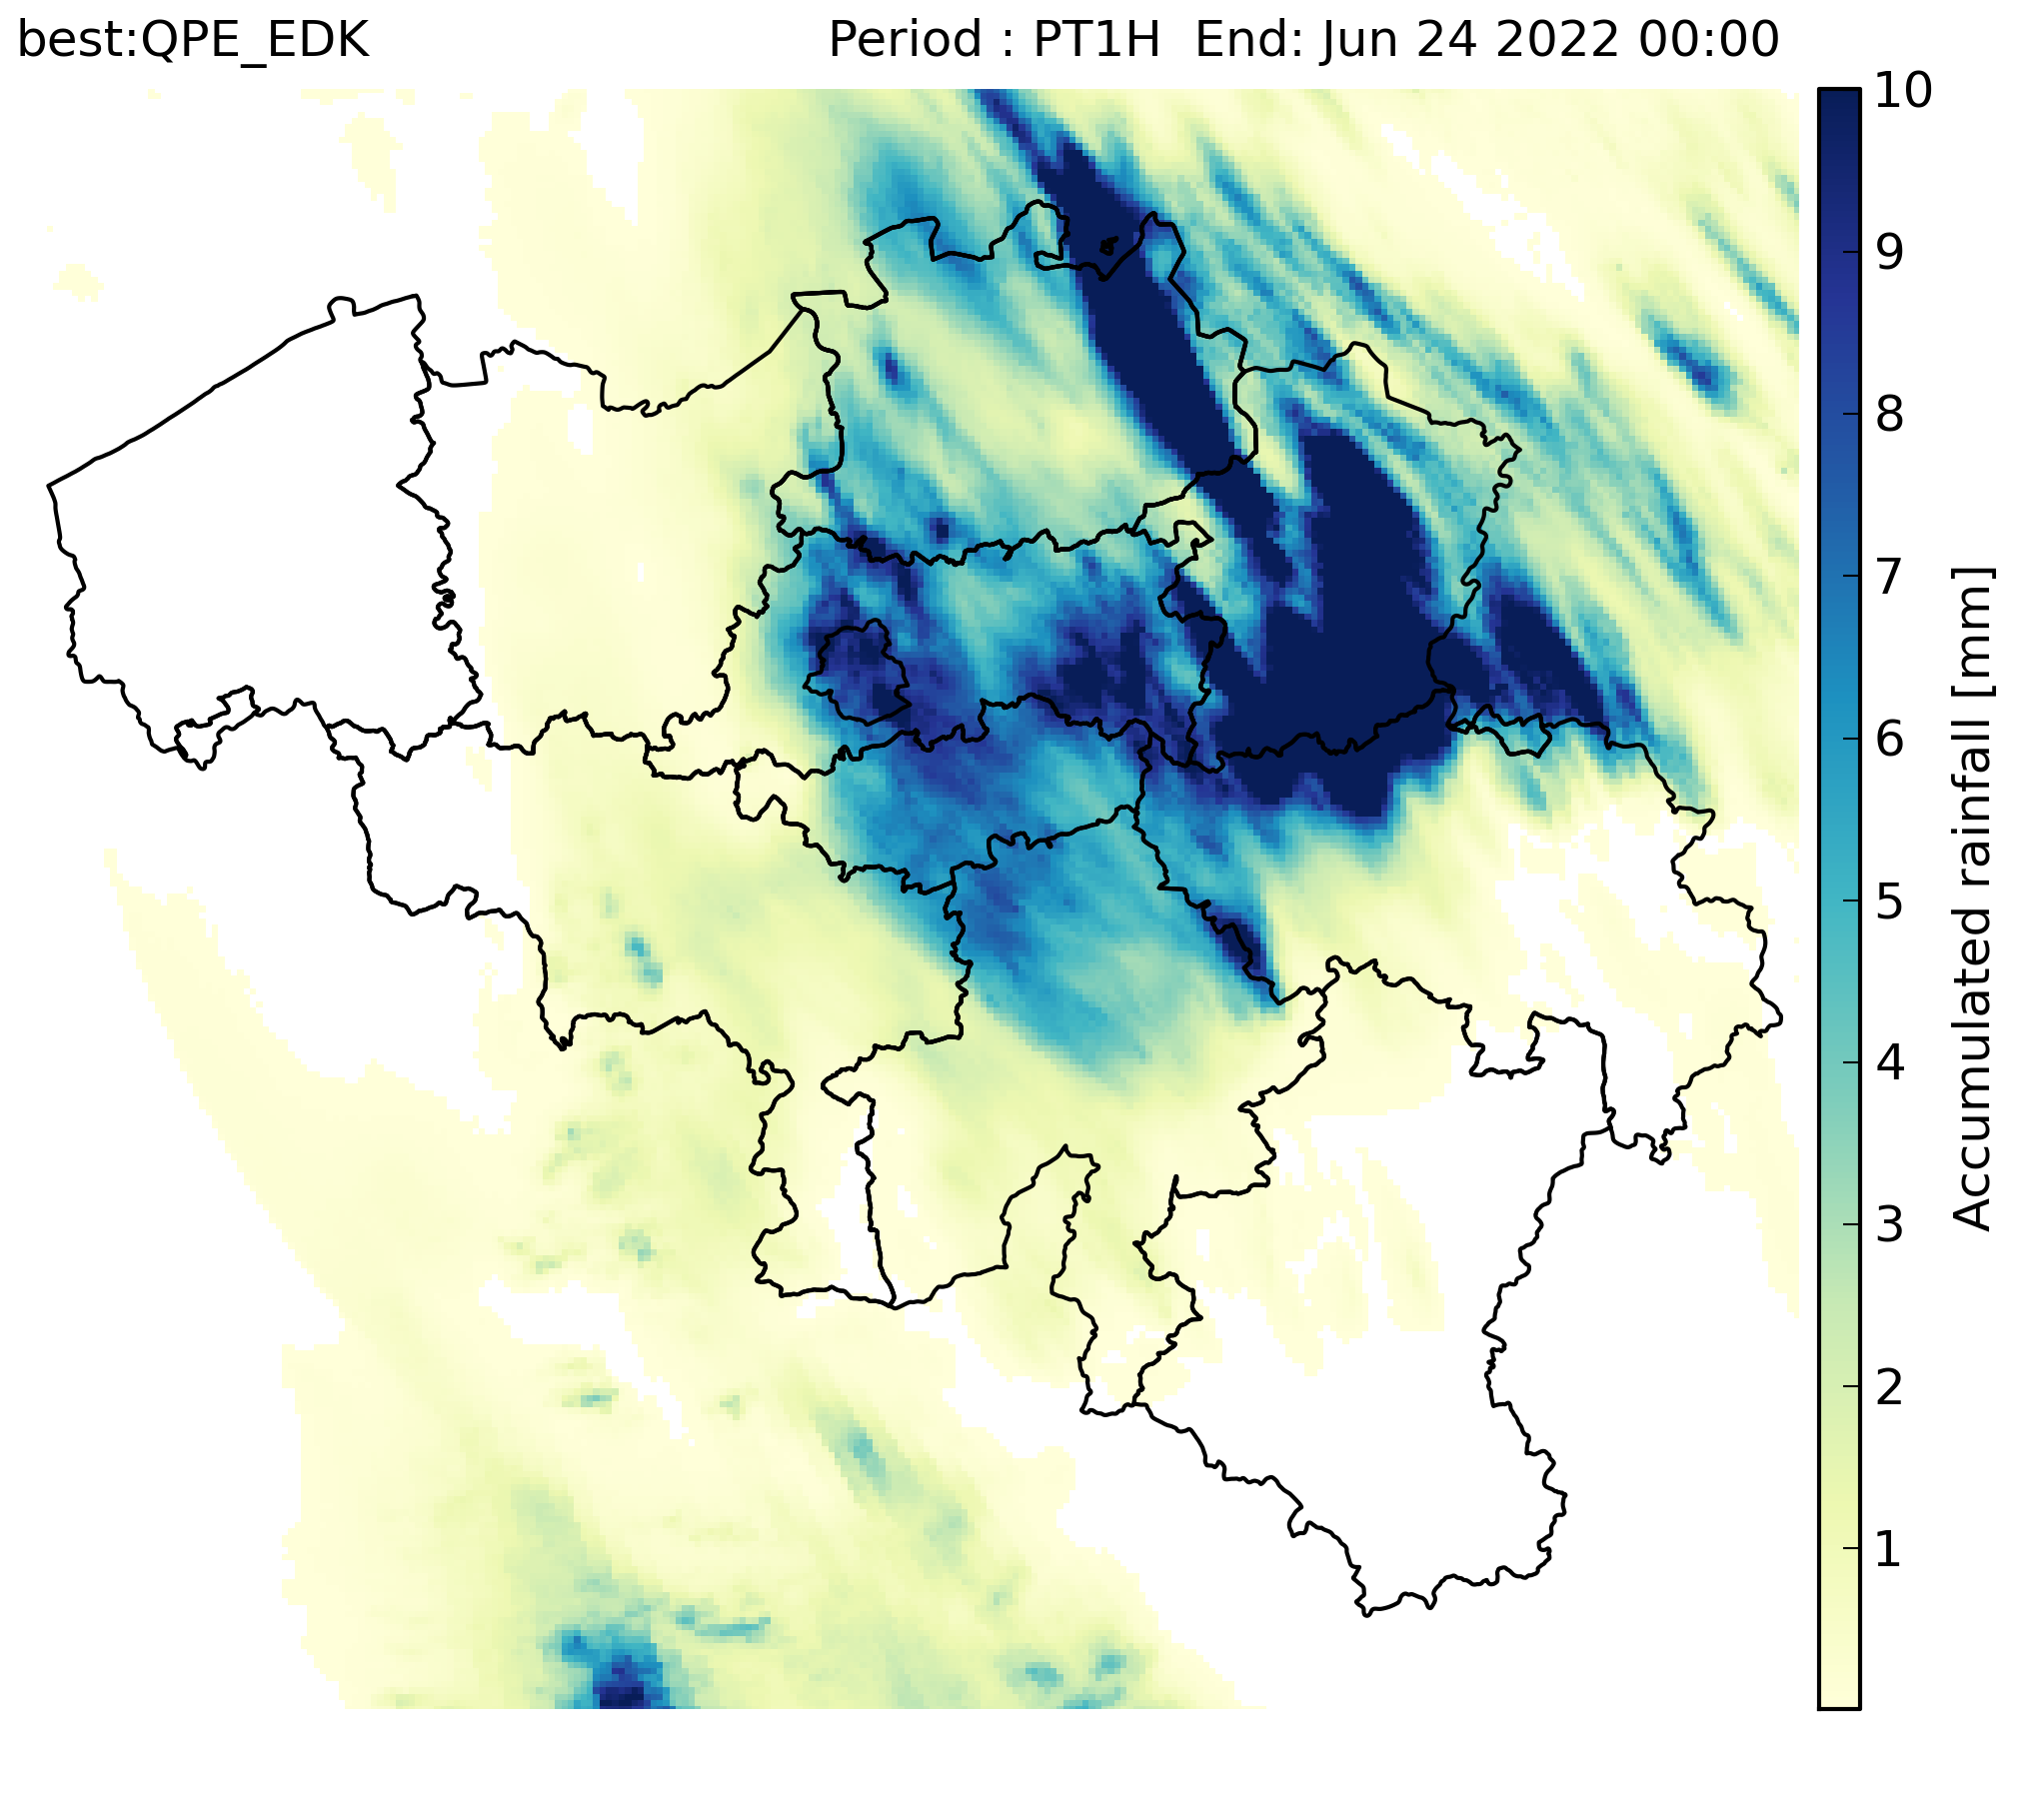
RADCLIM is a historical dataset based on weather radar observations that provides gridded accumulated precipitation composites over Belgium and surrounding regions. The data are distributed in ODIM_H5 version 2.2 format. The reported quantity is accumulated precipitation (ACRR) for 5-minute and 1-hour accumulation periods. UTC is used as the time reference, and the timestamp in the filename corresponds to the end of the accumulation period. The dataset is produced on a 700 × 700 grid with 1 km spatial resolution in the Belgian Lambert 2008 projection (Lambert Conformal Conic).
-
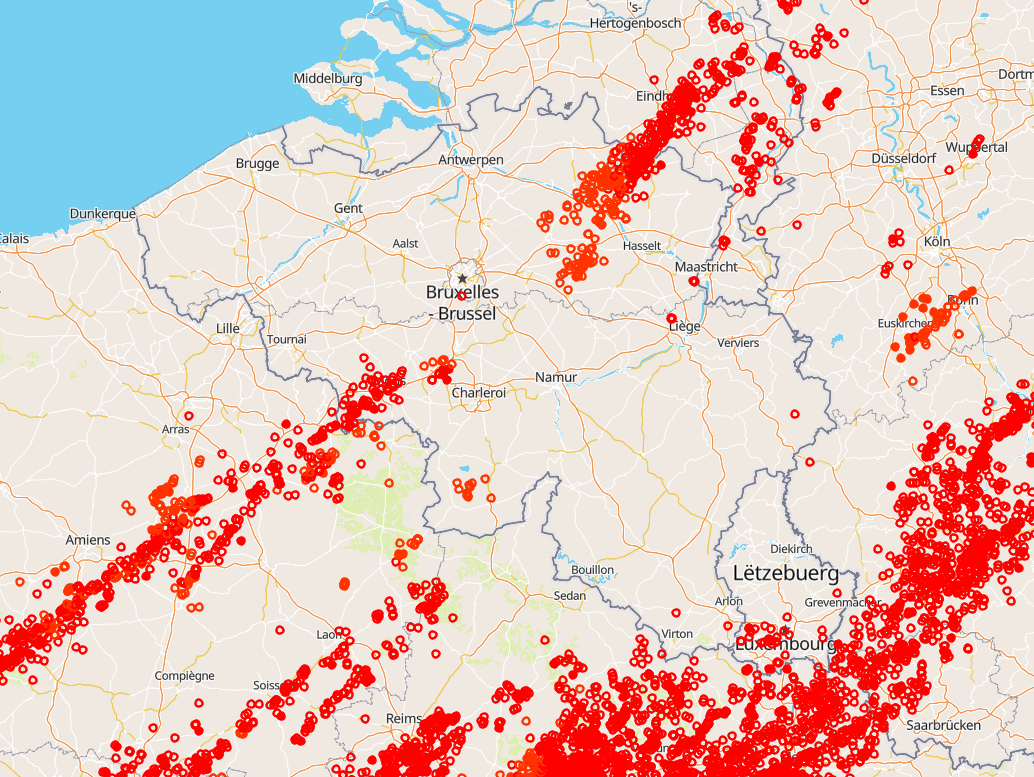
Total lightning observations, i.e., cloud-to-ground (CG) strokes and intra/inter-cloud (IC) pulses, in Belgium. BELLS data is given in Universal Time! (local time winter = UT +1; local time summer = UT + 2). Each record contains following fields: 1. Network type, 0 = LF, 1 = VHF-TOA, 2 = VHF-ITF, 3 = VLF 2. Year, 1970 to 2032. 3. Month, with January as 1 and December as 12. 4. Day of the month, 1 to 31. 5. Hour, 0 to 23. 6. Minute, 0 to 59. 7. Second, 0 to 60. 8. Nanosecond, 0 to 999999999. 9. Latitude of the calculated location in decimal degrees, to 4 decimal places, -90.0 to 90.0. 10. Longitude of the calculated location in decimal degrees, to 4 decimal places, -180.0 to 180.0. 11. Altitude in meters, -4950 to +60535. This field will be 0 if the altitude is not provided in the lightning data. 12. The altitude uncertainty in meters. This field will be 0 if the altitude uncertainty is not provided in the lightning data. 13. Estimated peak current in kiloamps, -9999 to 9999. 14. VHF Range normalized power, -9999.0 to 9999.0 15. Multiplicity for flash data (1 to 99) or 0 for strokes. 16. Cloud pulse count for the lightning record. This field will be -1 if the lightning did not contain the cloud pulse count attribute. 17. Number of sensors participating in the solution, 2 to 99. 18. Degrees of freedom when optimizing location, 0 to 99. 19. The error ellipse angle as a clockwise bearing from 0 degrees north, 0 to 180.0 degrees 20. The error ellipse semi-major axis length in kilometers, 0 to 50.0km. 21. The error ellipse semi-minor axis length in kilometers, 0 to 50.0km. 22. Chi-squared value from location optimization, 0 to 999.99 23. Rise time of the waveform in microseconds, 0 to 99.9 24. Peak-to-zero time of the waveform in microseconds, 0 to 999.9 25. Maximum rate-of-rise of the waveform in kA/usec (will be a negative rate if discharge is negative), -999.9 to 999.9 26. Cloud indicator, 1 if Cloud-to-cloud discharge, 0 for Cloud-to-ground 27. Angle indicator, 1 if sensor angle data used to compute position, 0 otherwise 28. Signal indicator, 1 if sensor signal data used to compute position, 0 otherwise 29. Timing indicator, 1 if sensor timing data used to compute position, 0 otherwise 30. Flash ID, a unique integer value identifying the flash grouping a stroke belongs to or 0 if not set. This product is not publically available yet.
-
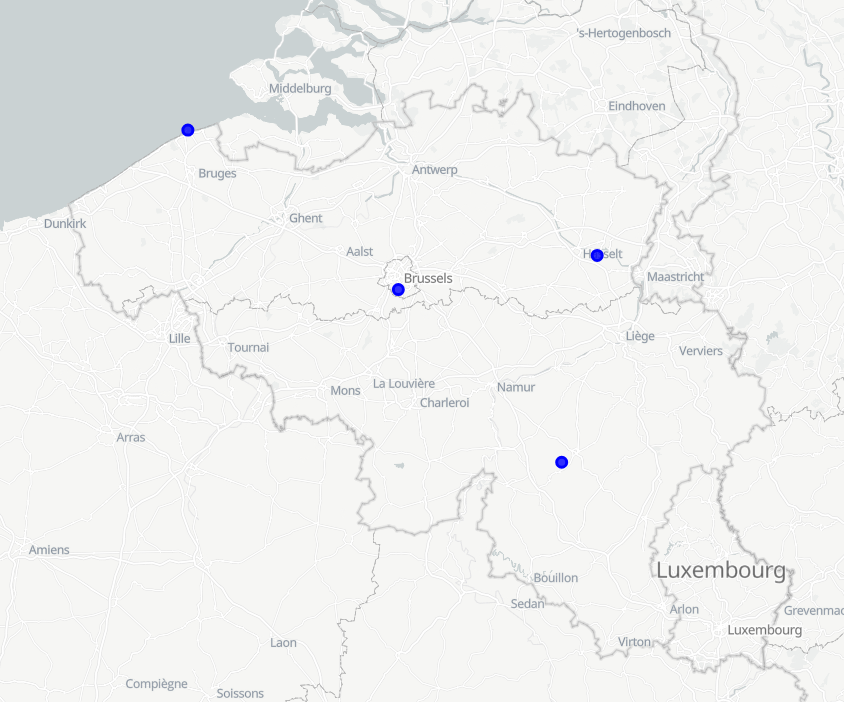
RMI operates a network of 17 automatic weather stations in Belgium. These weather stations report meteorological paramaters such as air pressure, temperature, relative humidity, precipitation (quantity,duration), wind (speed, gust, direction), sunshine duration, shortwave solar radiation and infrared radiation every 10 minutes.
-
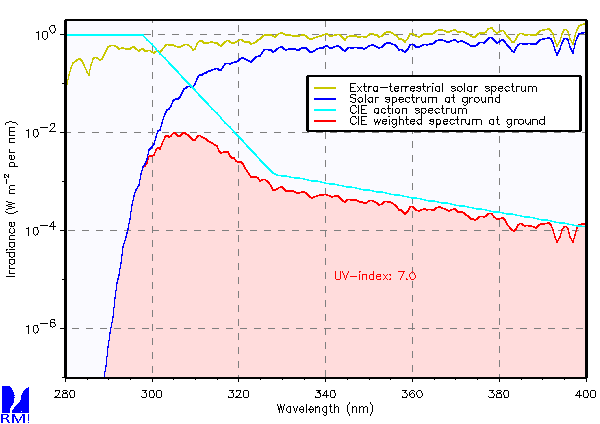
UV Index derived from spectral measurements with a Brewer UV spectrophotometer. This product is not publically available yet.
-
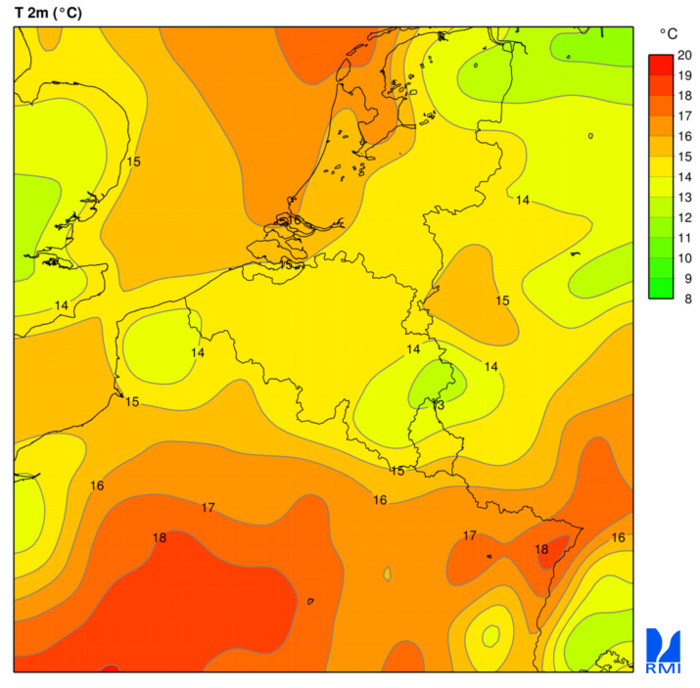
Weather Model 'Alaro' A numerical forecast model is a computer program that simulates the evolution of the atmosphere. Available parameters : Temperature, Max. temperature, Min. temperature, Dewpoint temperature, Wet-bulb potential temperature, Cloud cover (low, medium, high, tot.), U and V wind component, U, V and vertical velocity, Stationary boundary layer (SBL) Gust, Total precipitation, Large scale rain, Convective rain, Large scale snow, Convective snow, Relative Humidity, Specific humidity, Geopotential, Mean sea level pressure, Orography, freezing level / 0°C isotherm, Convective available potential energy (CAPE)