 geo.be Metadata Catalog
dataset
Type of resources
Available actions
Topics
INSPIRE themes
federalThemes
Keywords
Contact for the resource
Provided by
Years
Formats
Representation types
Update frequencies
status
Scale
Resolution
-
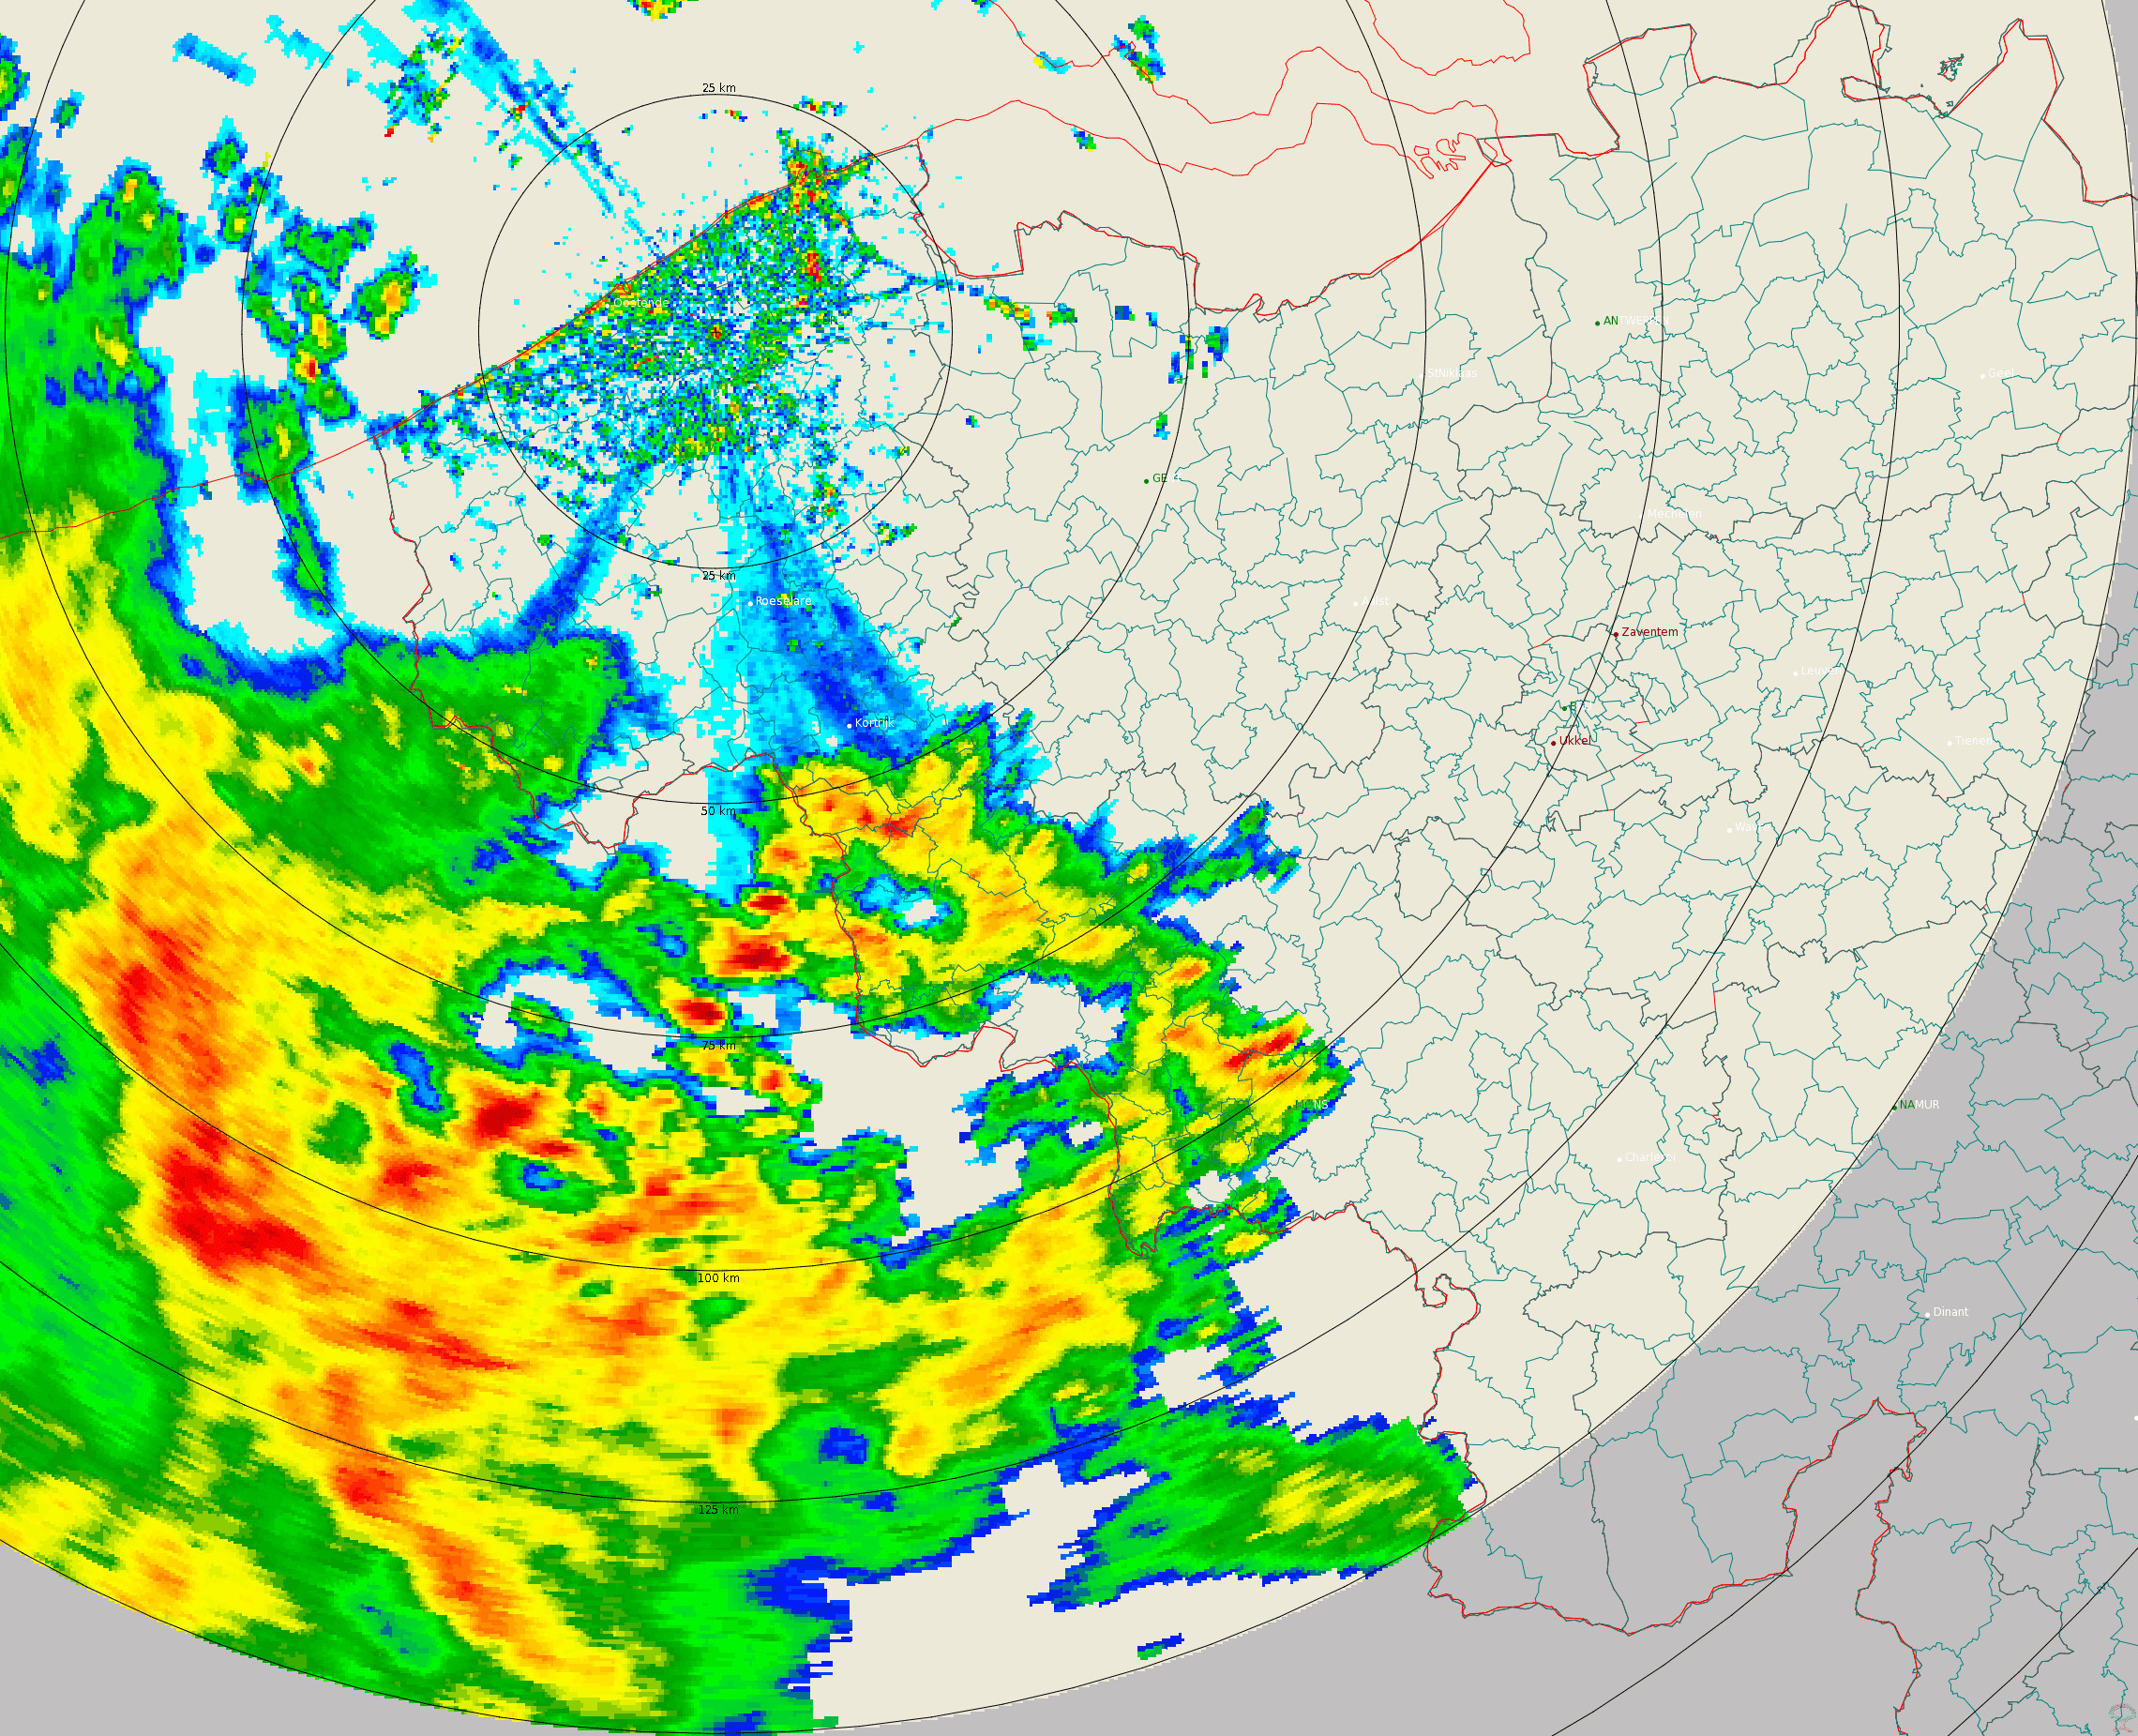
Polar volume reflectivity data from the Jabbeke weather radar. Volume data files are produced every 5 minutes from a multiple elevation scan. This product is not publicly available yet.
-

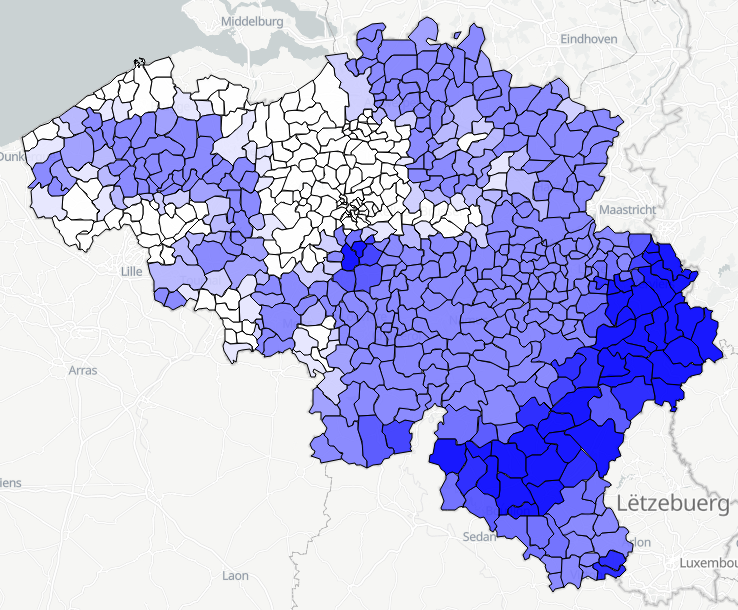
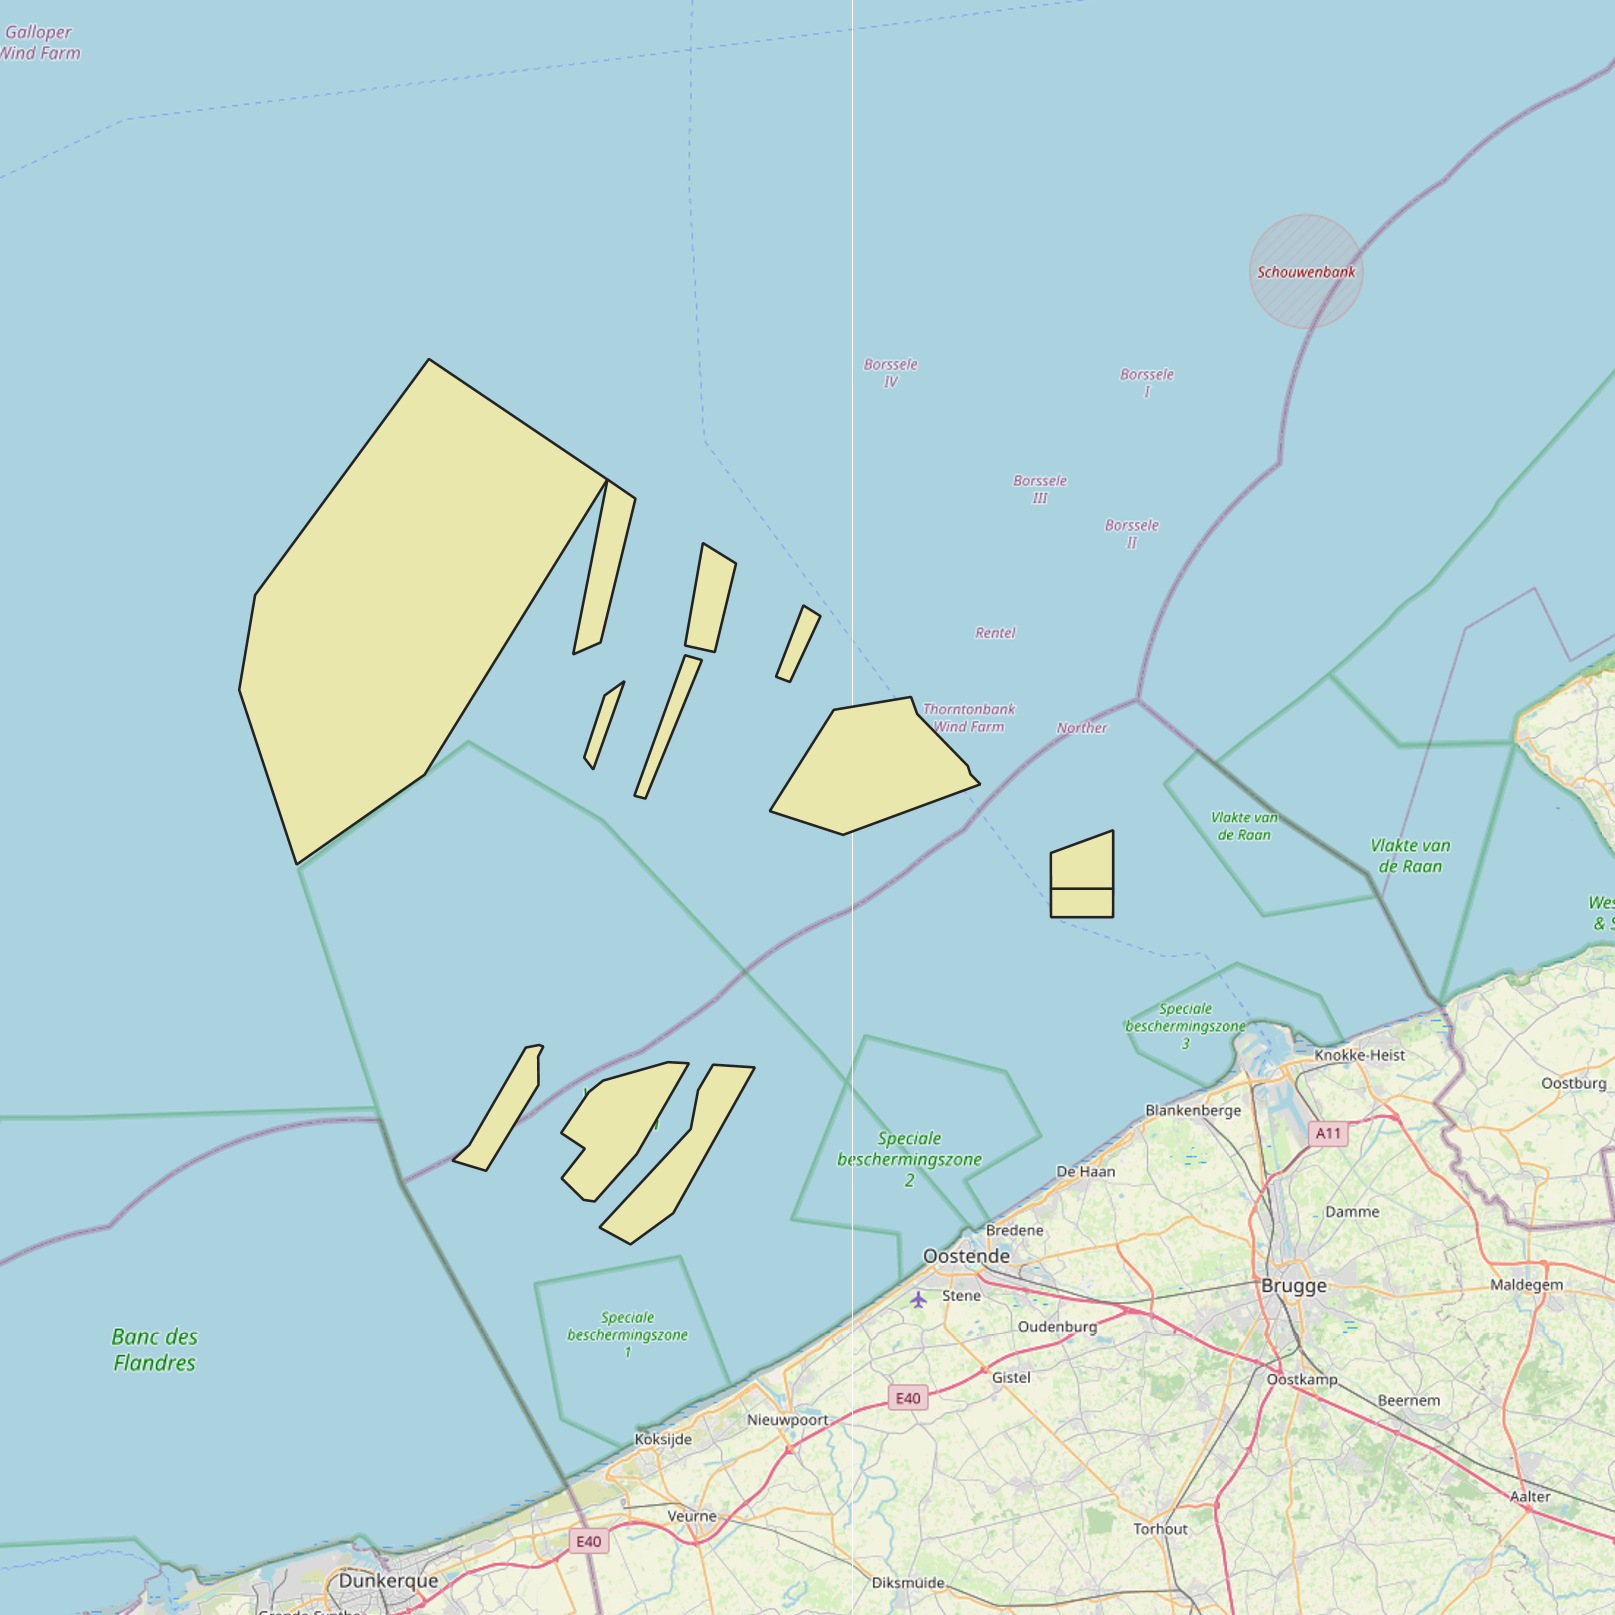
This dataset is part of the 2018 Belgian submission for the Marine Strategy Framework Directive (MSFD) linked to descriptor 6, criterion 2. This dataset describes and maps the physical disturbance to the seabed in the Belgian part of the North Sea (BPNS) between 2011 and 2016. The dataset combines different layers of human activities leading to a disturbance of the seabed, including power cables with its rock dump, dredging and dumping, extraction, war ammunition stocking and wind farms. The area disturbed is mapped and quantified per year, per activity and per benthic broad habitat.
-
UNDER EMBARGO - This dataset contains seasonal physiological measurements from controlled laboratory experiments on two dominant suspension-feeding species expected to colonise floating offshore structures: the blue mussel (Mytilus edulis; AphiaID 140480) and the wrinkled barnacle (Balanus crenatus; AphiaID 106215). The measured parameters include clearance rates, respiration rates, faecal pellet production rates, and faecal pellet sinking velocities. Mussels were collected from an aquaculture longline at the Westdiep SeaFarm, while barnacles were manually retrieved from the intertidal beachhead at Raversijde (Oostende, Belgium). All experiments were conducted using natural seawater collected from offshore sites in the Belgian part of the North Sea. Measurements were repeated across multiple seasons to capture temporal variability in physiological performance. The dataset was produced within the SWiM and EcoMPV projects and is suitable for reuse in ecosystem and biogeochemical modelling, including simulations of phytoplankton dynamics associated with large-scale offshore marine photovoltaic (MPV) developments.
-
This dataset describes the location of the samples gathered for the Scientific research program DGL-JW (2021-15) managed bu the FPS Environment. Sampling started in 2004 and lasted until 2021.
-
Daily forecasts for each Belgian commune, from current day up to the next 14 days. Available parameters are : min temperature, max temperature, weather type, wind speed, wind direction, maximum hust speed, quantity of precipitation. This product is not publicly available.
-
This dataset is part of the 2018 Belgian submission for the Marine Strategy Framework Directive (MSFD) linked to descriptor 9, criterion 1. The dataset contains the results of analyses on raw fish, mollusk and crustacean samples originating from the southern North Sea and the Channel and taken as part of the control programme by the Federal Agency for the Safety of the Food Chain. The analyzed substances are metals (cadmium, mercury and lead), dioxins and dioxin-like PCBs, PCBs, PAHs, Cesium 134 and Cesium 137.
-
This dataset is part of the 2018 Belgian submission for the Marine Strategy Framework Directive (MSFD) linked to descriptor 8, criterion 4. This dataset contains measurements on the 7-Ethoxyresorufin-O-deethylase (EROD) activity in Limanda limanda, Imposex (OTIN in Mytilus edulis), fish diseases and counts of oiled common guillemots in the Belgian part of the North Sea.
-
This dataset is part of the 2018 Belgian submission for the Marine Strategy Framework Directive (MSFD) linked to descriptor 1, criterion 2. The Raja clavata dataset describes the results of the Offshore Beam Trawl Surveys (BTS) in the Belgian part of the North Sea (BPNS) between 2010 and 2017. Occurrences of Raja Clavata, along with dates and locations, are reported. The codes used in the attached file are based on the ICES DATRAS (Database of Trawl Surveys) standard. The seabirds dataset describes the density of seabirds (N birds/km) observed in the BPNS between 1987 and 2016 (three surveys a year).
-
This dataset is part of the 2018 Belgian submission for the Marine Strategy Framework Directive (MSFD) linked to descriptor 6, criterion 5. It comprises three datasets used to assess the sea floor integrity for ensuring a proper functioning of the ecosystem.The dataset on the study of the fauna associated with cobble fields (hard substrates) describes the gravel analysis performed in the Belgian part of the North Sea between 2015 and 2017. Information on the location, date and procedure used for the sediment sampling is provided as well as the description of species found in the samples.The occurrence of important benthic species. The status of benthic habitats (soft substrates).
-
UNDER EMBARGO - This dataset is part of BE/2023 sampling campagn in SW Greenland fjords (Igaliku and Tunulliarfik). Samples for DNA extraction were collected along fjord transects at several depths of the water column. The focus of the study was to determine the taxonomical composotion of bacterial community in two Arctic fjords.