 geo.be Metadata Catalog
Type of resources
Available actions
Topics
INSPIRE themes
federalThemes
Keywords
Contact for the resource
Provided by
Years
Formats
Representation types
Update frequencies
status
Service types
Scale
Resolution
-
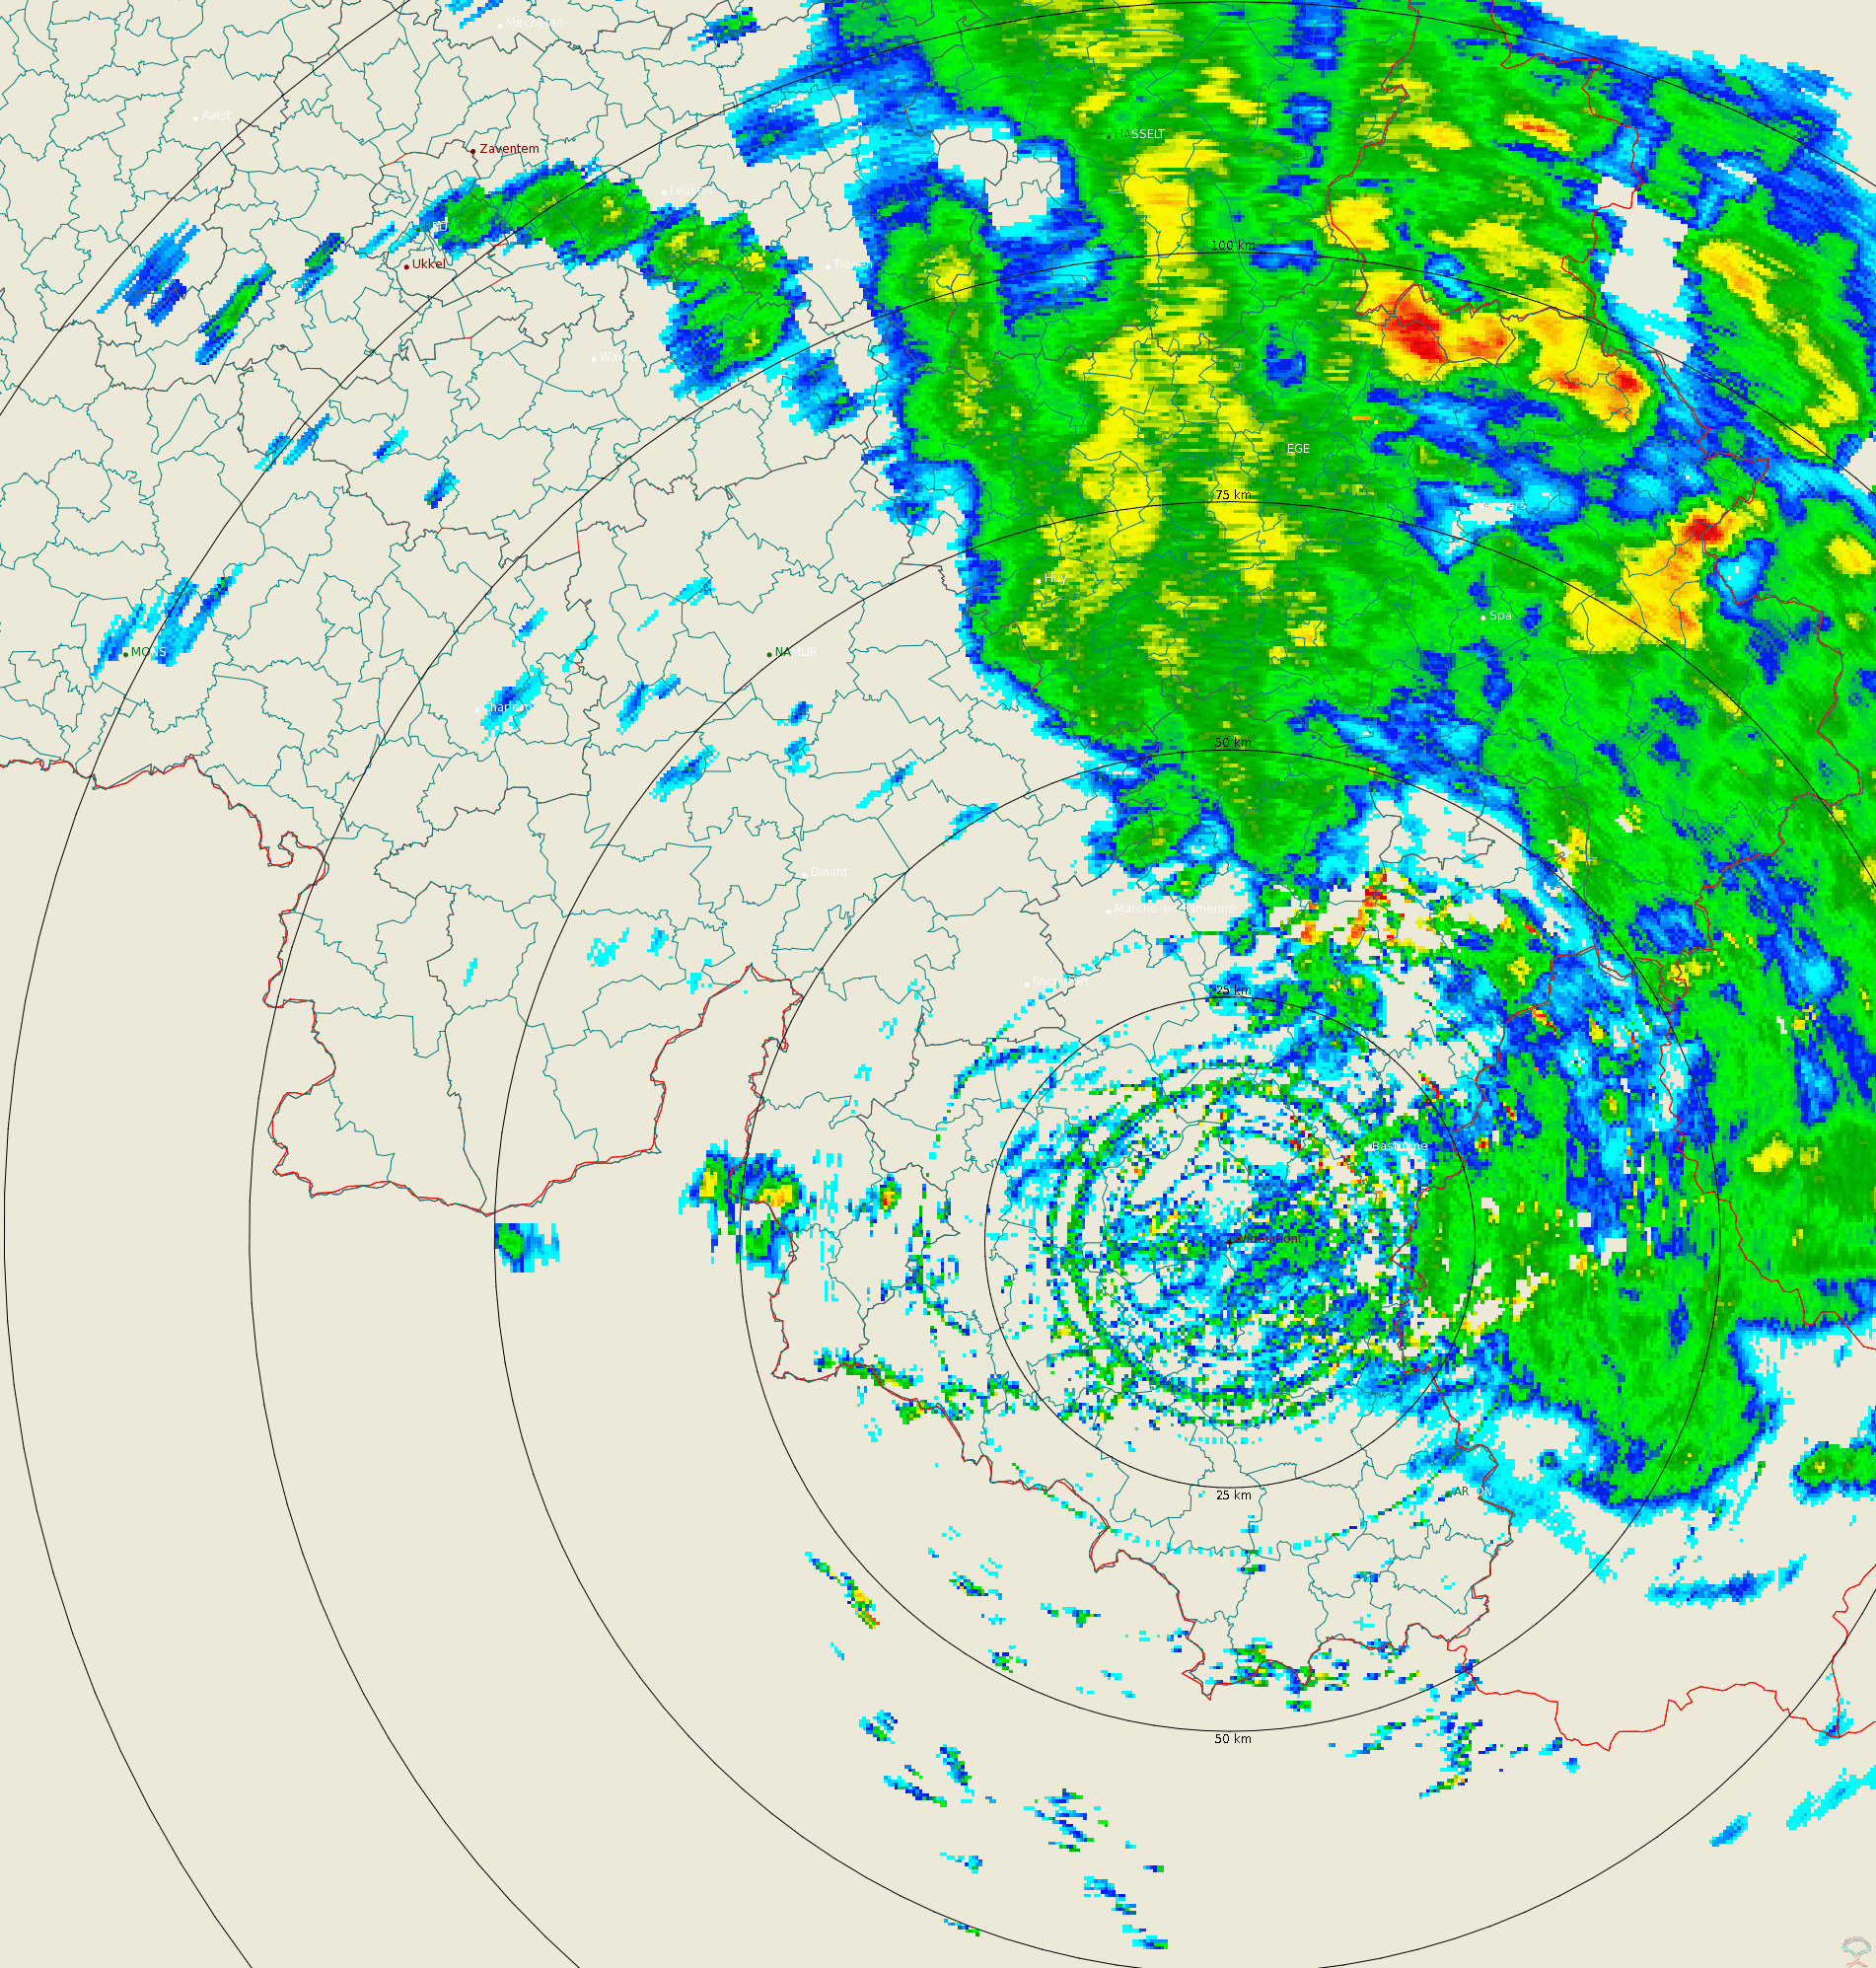
Polar volume reflectivity data from the Wideumont weather radar. Volume data files are produced every 5 minutes from a multiple elevation scan. This product is not publicly available yet.
-

The DTM 5m, digital terrain model at 5m-resolution, is a homogeneous and regular point grid indicating the height of the ground level in order to model its surface, without taking into account objects on the surface such as buildings and vegetation. The DTM 5m is the result of the assembly of different data coming from various sources and with different coordinate systems and resolutions. The DTM 1m is achieved by interpolating in Lambert 2008 source data in Lambert 72 and at a 1m-resolution from the Flemish (2013-2015) and Brussels (2021) regions, and by adding Lambert 2008 data at 1m-resolution from the Walloon Region (2021-2022). The DTM 5m is obtained by resampling of the DTM 1m. In addition, the DTM 5m is improved and updated internally using direct photogrammetric surveys based on the most recent aerial photographs.
-
UNDER EMBARGO - This dataset contains the data on porewater nutrients, sediment granulometry, and pigment concentrations that were collected in the C-power offshore wind farm in spring, summer, and autumn of 2022 for the OUTFLOW project. Data were gathered at increasing distances from the scour protection layer (SPL) of a wind turbine, 7, 15, 25, and 75 m away from the edge. Cores were collected by divers, and a boxcore was used for samples 75 m away. From these cores, porewater nutrients were collected with rhizon samplers, and cores were slices in 0.5 to 2 cm slices, and each slice was analyzed for total organic carbon, total nitrogen, granulometry, and algal pigment concentrations.
-

This dataset is part of the 2018 Belgian submission for the Marine Strategy Framework Directive (MSFD) linked to descriptor 5, criterion 1. This dataset contains the nutrient concentrations (ammonia, nitrate, nitrite, total nitrogen, phosphorus) measured on water samples taken in the BPNS between 2011 and 2016. The analysis of nutrients (N and P) is ensured by the national monitoring programme at ten sampling locations that are representative for the surrounding water masses. Based on all 2011-2016 results, the relationship with the salt content was calculated and, for each year, the value derived corresponding to a salt content of 33.5. The surface of the area where the nutrient concentrations exceed the respective thresholds was calculated on the basis of the relationship with the winter salt content and a climatology of the spatial distribution of the salt content (see annex D5 of the Belgian MSFD report). The resulting maps give a good overview of nutrient concentrations in the Belgian zone. In order to take into account the coastal-sea gradient and to illustrate the temporal trends in detail, the concentrations were also evaluated in three different areas of the BPNS: the coastal zone, the territorial zone and the open-sea zone. The long-term trends of nutrient concentrations in the three zones were assessed statistically.
-
This dataset is part of the 2018 Belgian submission for the Marine Strategy Framework Directive (MSFD) linked to descriptor 11, criterion 1. This dataset describes the impulsive noise generated during percussion pile emplacement for offshore wind farm construction and unexploded ordnance (UxO) explosions. Impulsive underwater sound (pressure) was measured during pile driving operations in Belgian waters, for different types of foundations (monopiles of different diameters, foundations of ducts with a smaller diameter) and hydraulic hammers with different energy powers. The results of measurements at Bligh Bank and Thornton Bank, with a resulting extrapolation of zero to peak noise level (Lz-p) at 750m and Sound Exposure Level (SEL) (no mitigation measures deployed), are presented (Norro et al., 2013).
-
UNDER EMBARGO - This dataset originates from the BE/2023 sampling campaign conducted in southwest Greenland fjords (Igaliku and Tunulliarfik) and quantifies grazing impacts by micro- and mesozooplankton on phytoplankton and heterotrophic microbial communities (including bacteria) in two fjord systems characterized by contrasting glacial regimes. Grazing and microbial growth rates were estimated using two-point dilution experiments (two-point dilution experiments), alongside experiments assessing mesozooplankton and copepod grazing on both phytoplankton and microzooplankton. Community responses were resolved using imaging flow cytometry, enabling the identification of plankton functional groups (autotrophic, mixotrophic, and heterotrophic) and size classes. The dataset also includes measurements of chlorophyll a variability determined by high-performance liquid chromatography. Overall, the dataset supports analyses of trophic interactions and grazing dynamics across the microbial food web under differing glacier-influenced environmental conditions.
-
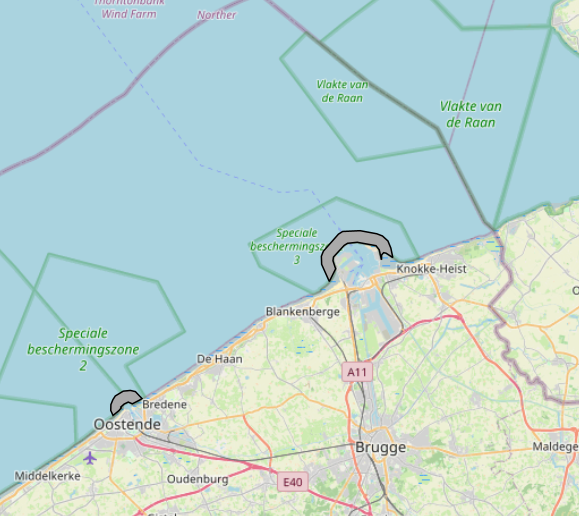
The Royal Decree of 20 March 2026 establishing the marine spatial plan for the period 2026 to 2034 in the Belgian marine areas defines 2 potential seaport expansion zones: Potential expansion of the Port of Ostend (Art. 16§2), Potential expansion of the Port of Zeebrugge (Art. 16§3). It replaces the 2020 Marine Spatial Plan. Please refer to the Belgian official gazette ("Moniteur belgeBelgisch Staatsblad") for official reference information.
-
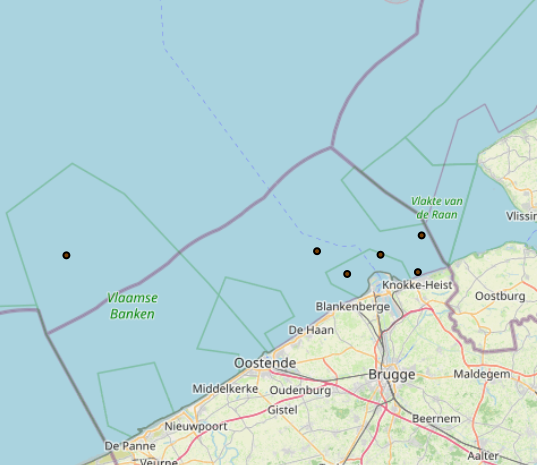
The Royal Decree of 20 March 2026 establishing the marine spatial plan for the period 2026 to 2034 in the Belgian marine areas defines 1 measuring pole: Measurement poles (Art. 25§2). It replaces the 2020 Marine Spatial Plan. Please refer to the Belgian official gazette ("Moniteur belgeBelgisch Staatsblad") for official reference information.
-
The law of 13 June 1969 defines “Belgian Continental Shelf” as follows: the seabed and the subsoil of the marine areas adjacent to the Belgian coast but beyond the Belgian territorial sea.
-
This view service allows visualization of the IGN digital terrain model at a resolution of 5m (DTM 5m) as well as the shaded version (Hillshade DTM 5m) of it.