 geo.be Metadata Catalog
2025
Type of resources
Available actions
Topics
INSPIRE themes
federalThemes
Keywords
Contact for the resource
Provided by
Years
Formats
Representation types
Update frequencies
status
Service types
Scale
Resolution
-
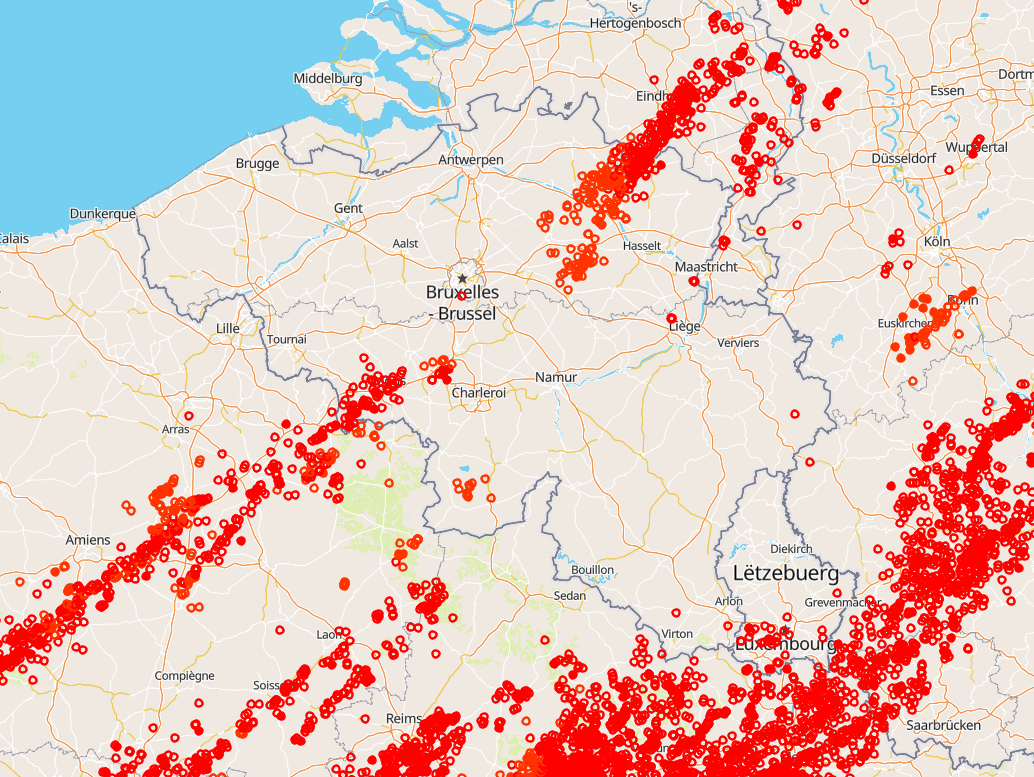
Total lightning observations, i.e., cloud-to-ground (CG) strokes and intra/inter-cloud (IC) pulses, in Belgium. BELLS data is given in Universal Time! (local time winter = UT +1; local time summer = UT + 2). Each record contains following fields: 1. Network type, 0 = LF, 1 = VHF-TOA, 2 = VHF-ITF, 3 = VLF 2. Year, 1970 to 2032. 3. Month, with January as 1 and December as 12. 4. Day of the month, 1 to 31. 5. Hour, 0 to 23. 6. Minute, 0 to 59. 7. Second, 0 to 60. 8. Nanosecond, 0 to 999999999. 9. Latitude of the calculated location in decimal degrees, to 4 decimal places, -90.0 to 90.0. 10. Longitude of the calculated location in decimal degrees, to 4 decimal places, -180.0 to 180.0. 11. Altitude in meters, -4950 to +60535. This field will be 0 if the altitude is not provided in the lightning data. 12. The altitude uncertainty in meters. This field will be 0 if the altitude uncertainty is not provided in the lightning data. 13. Estimated peak current in kiloamps, -9999 to 9999. 14. VHF Range normalized power, -9999.0 to 9999.0 15. Multiplicity for flash data (1 to 99) or 0 for strokes. 16. Cloud pulse count for the lightning record. This field will be -1 if the lightning did not contain the cloud pulse count attribute. 17. Number of sensors participating in the solution, 2 to 99. 18. Degrees of freedom when optimizing location, 0 to 99. 19. The error ellipse angle as a clockwise bearing from 0 degrees north, 0 to 180.0 degrees 20. The error ellipse semi-major axis length in kilometers, 0 to 50.0km. 21. The error ellipse semi-minor axis length in kilometers, 0 to 50.0km. 22. Chi-squared value from location optimization, 0 to 999.99 23. Rise time of the waveform in microseconds, 0 to 99.9 24. Peak-to-zero time of the waveform in microseconds, 0 to 999.9 25. Maximum rate-of-rise of the waveform in kA/usec (will be a negative rate if discharge is negative), -999.9 to 999.9 26. Cloud indicator, 1 if Cloud-to-cloud discharge, 0 for Cloud-to-ground 27. Angle indicator, 1 if sensor angle data used to compute position, 0 otherwise 28. Signal indicator, 1 if sensor signal data used to compute position, 0 otherwise 29. Timing indicator, 1 if sensor timing data used to compute position, 0 otherwise 30. Flash ID, a unique integer value identifying the flash grouping a stroke belongs to or 0 if not set. This product is not publically available yet.
-
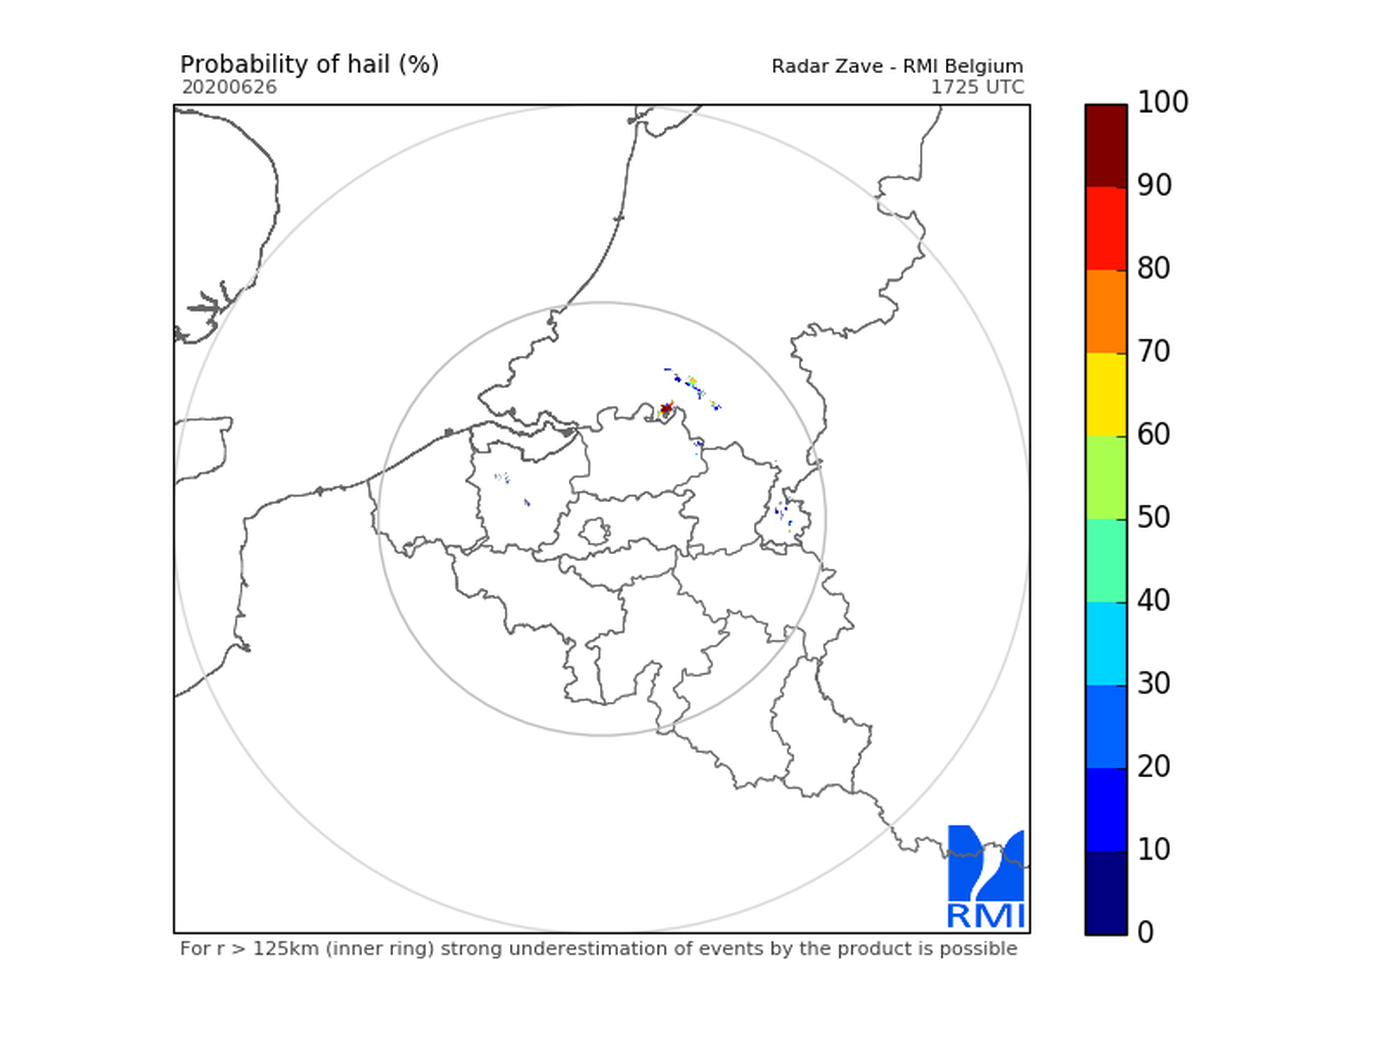
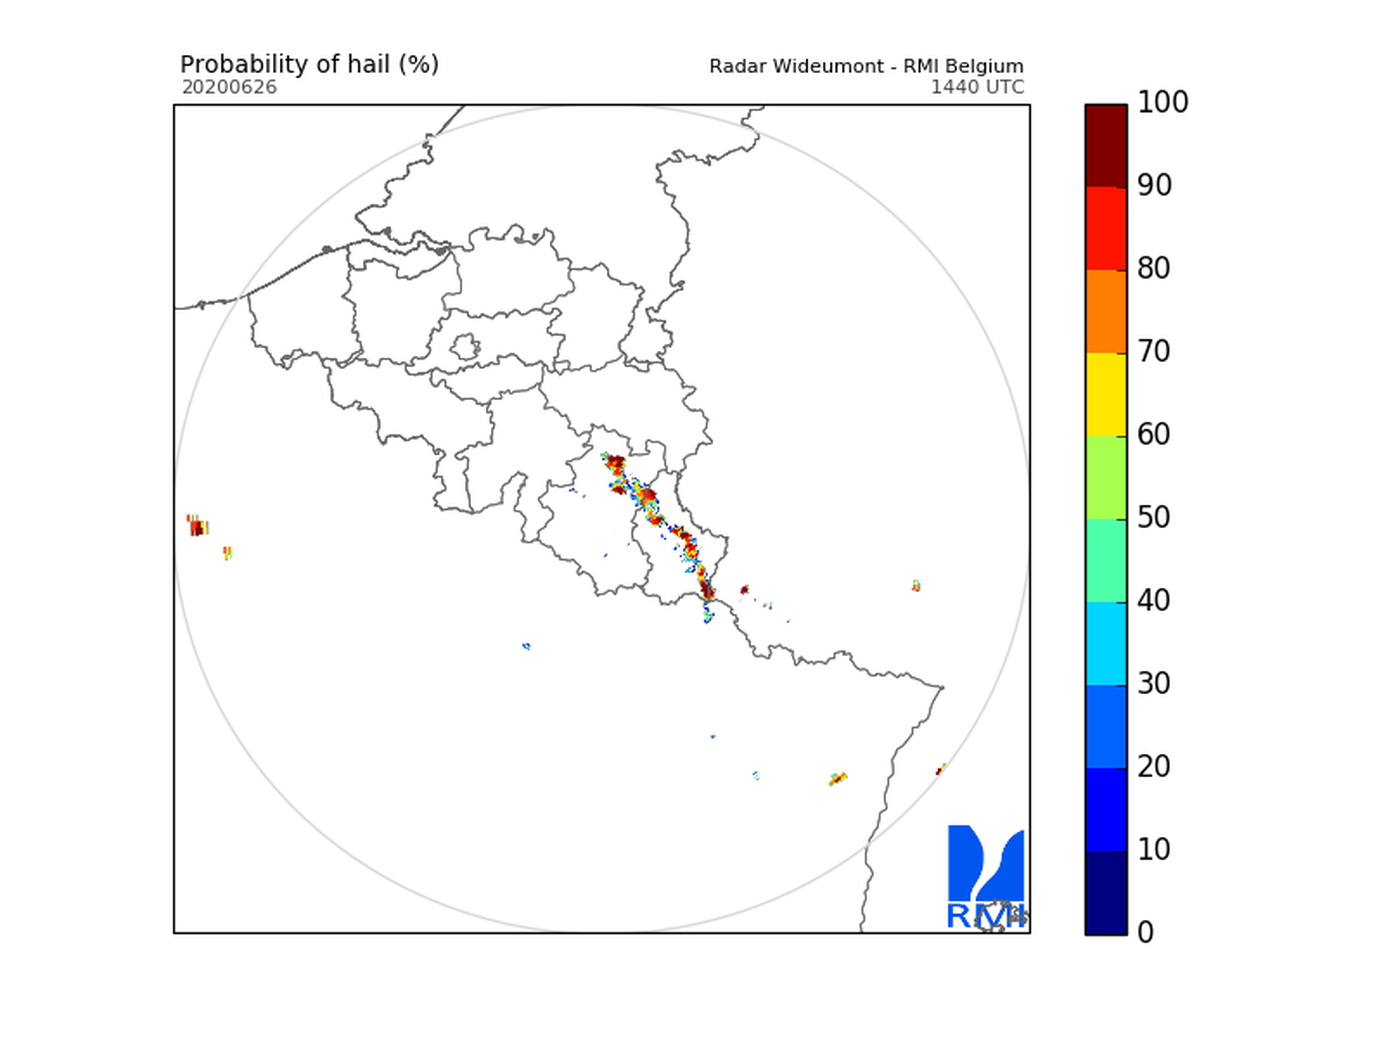
Hail products are derived from the observed vertical profiles of radar reflectivity and the NWP vertical profiles of temperature. Three types of products are generated. poh : probability of hail of any size (larger than 0.5 cm diameter)expressed in %. posh : probability of severe hail(larger than 2cm)expressed in %. mesh : maximum expected size of hailexpressed in mm of hailstone diameter. All products are generated every 5 minutes. This product is not publically available yet.
-
Weather model INCA. Available parameters : 2m Temperature, 2m Dewpoint, 2m Relative Humidity, Snowfall level, Freezing level, 3D Temperature, 3D Humidity, 3D Wind, 10m Wind, 10m Gusts, Ground temperature, Wind chill, Precipitation, Precipitation type, Lightning, Collection of convective analysis fields:CAPE, CIN, LCL, Level of free convection,Lifted Index, Showalter Index, Deep ConvectionIndex, Trigger temperature, Trigger temperaturedeficit, Equivalent Pot. temperature, Moistureconvergence, Flow divergence, Precipitable water, Cloudiness, Visibility. This product is not publicly available yet
-
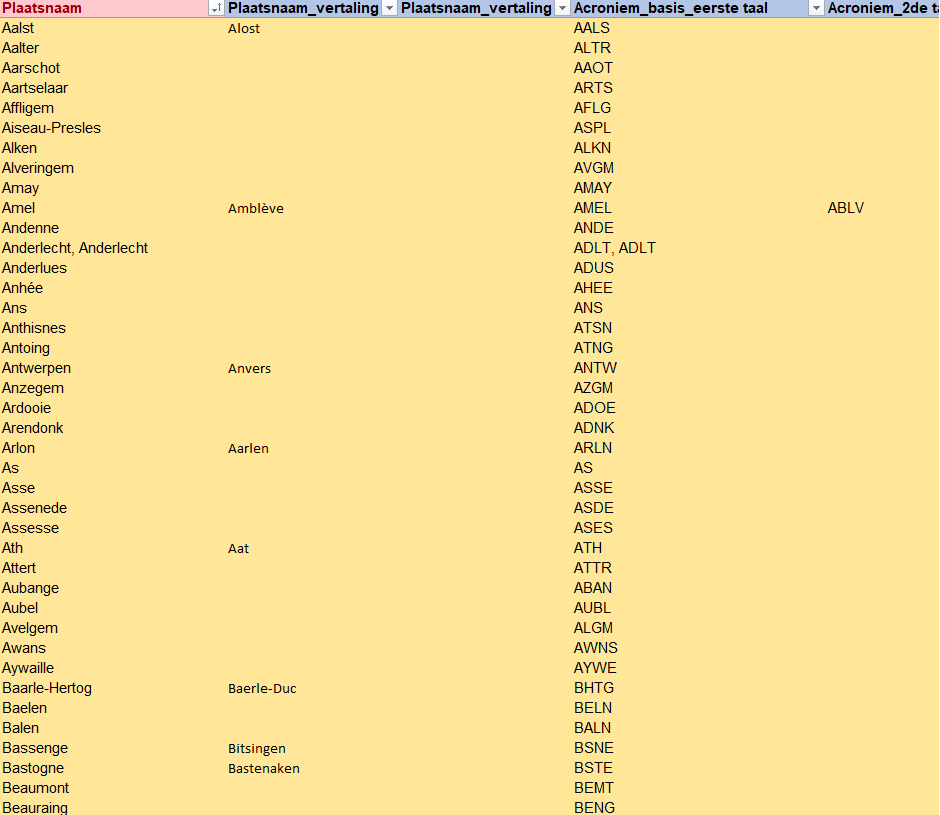
The reference list in Belgium for the unique abbreviations of all Belgian cities and municipalities. It also includes the submunicipalities, which do not have a clear definition.
-
This datasets is a summary of the CTD profiles measured with the RV Belgica. It provides general meta-information such as the campaign code, the date of measurement and the geographical information. An important information is the profile quality flag that describes the validity of the data. A quality flag = 2 means the data is generally good although some outliers can still be present. A quality flag = 4 means the data should not be trusted. 1 meter binned data can be download on the SeaDataNet CDI portal (enter the cruise_id in the search bar) ONLY for the good quality profiles. Full acquisition frequency datasets are available on request to BMDC.
-

Buyers' origin - Real estate companies corresponds to the dataset describing the origin of the buyers (legal persons engaged in real estate activities as defined in section L of the NACE-BEL 2008 nomenclature) of real estate located in Belgium according to the municipality of their headquarters for legal persons settled in Belgium and according to the country or territory of their headquarters for foreign legal persons (headquarter at the date of the deed). This dataset is made up of seven classes. The first class shows, at national level, for each type of property, the total number of parcels, the number of parcels acquired by buyers from each Belgian municipality and the number of parcels acquired by buyers from each country or territory. The number of parcels takes into account the shares actually acquired. The second class shows this information at the level of the three regions. The following classes do the same at the level of provinces, arrondissements, municipalities, land register divisions and statistical sectors. The dataset is freely downloadable, in the form of zipped CSV files.
-
Hail products are derived from the observed vertical profiles of radar reflectivity and the NWP vertical profiles of temperature. Three types of products are generated. poh : probability of hail of any size (larger than 0.5 cm diameter)expressed in %. posh : probability of severe hail(larger than 2cm)expressed in %. mesh : maximum expected size of hailexpressed in mm of hailstone diameter. All products are generated every 5 minutes. This product is not publically available yet.
-
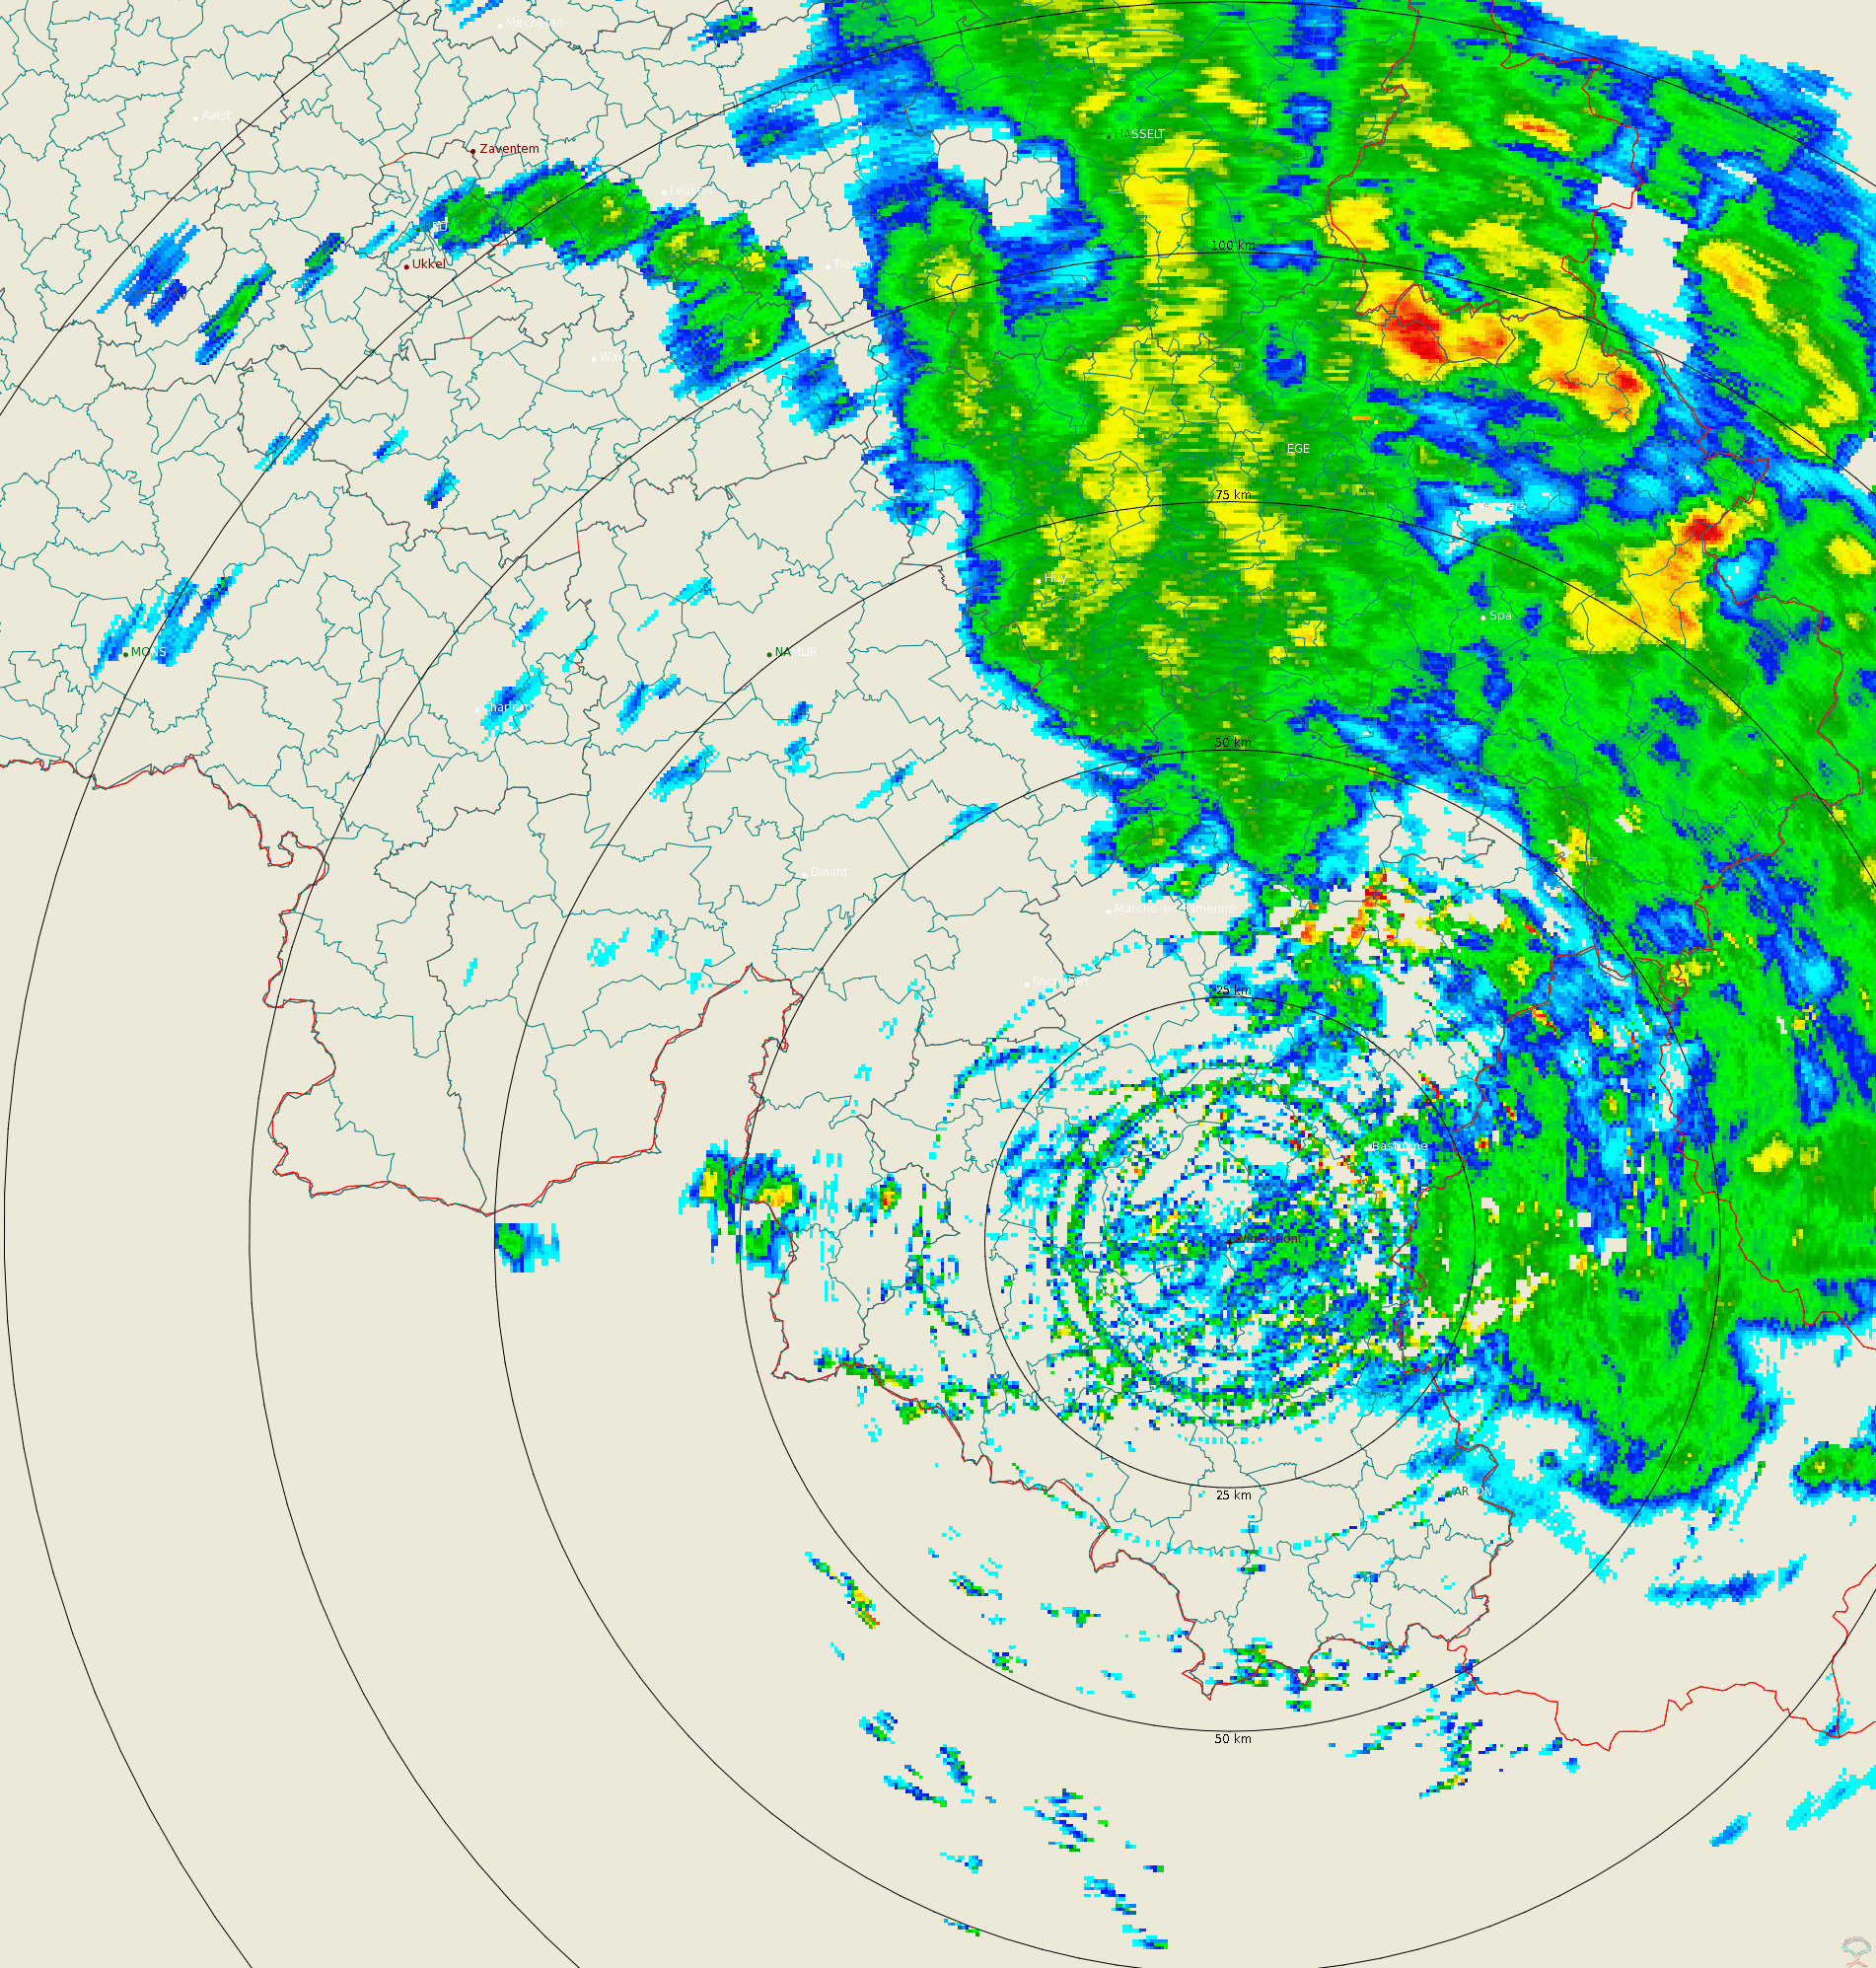
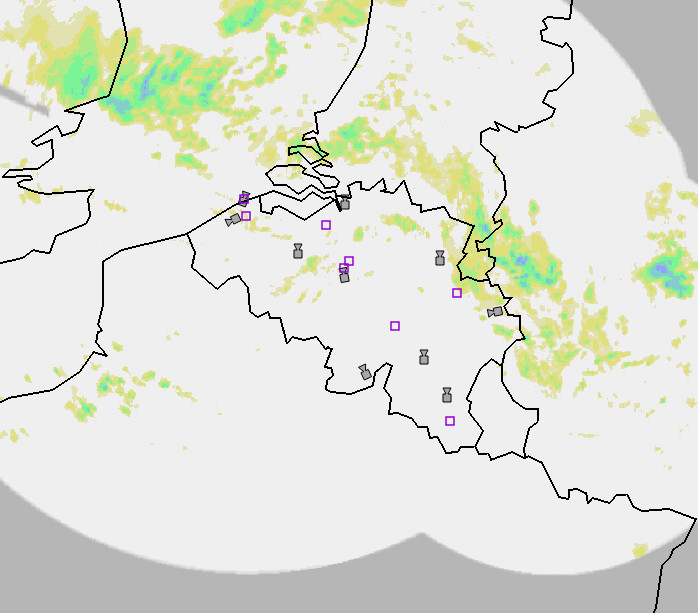
Polar volume reflectivity data from the Wideumont weather radar. Volume data files are produced every 5 minutes from a multiple elevation scan. This product is not publicly available yet.
-
Hail products are derived from the observed vertical profiles of radar reflectivity and the NWP vertical profiles of temperature. Three types of products are generated. poh : probability of hail of any size (larger than 0.5 cm diameter)expressed in %. posh : probability of severe hail(larger than 2cm)expressed in %. mesh : maximum expected size of hailexpressed in mm of hailstone diameter. All products are generated every 5 minutes. This product is not publically available yet.
-

Owners' origin - Real estate companies corresponds to the dataset describing the origin of the legal persons engaged in real estate activities (section L of the NACE-BEL 2008 nomenclature) that are holders of real rights over immovable properties located in Belgium according to the municipality of their headquarters for legal persons settled in Belgium and according to the country or territory of their headquarters for foreign legal persons. This dataset is made up of seven classes. The first class shows, at national level, for each type of property, the total number of parcels, the number of parcels held by holders from each Belgian municipality and the number of parcels held by holders from each country or territory. The number of parcels takes into account the shares actually held. The second class shows this information at the level of the three regions. The following classes do the same at the level of provinces, arrondissements, municipalities, land register divisions and statistical sectors. The dataset is freely downloadable, in the form of zipped CSV files.