 geo.be Metadata Catalog
asNeeded
Type of resources
Available actions
Topics
INSPIRE themes
federalThemes
Keywords
Contact for the resource
Provided by
Years
Formats
Representation types
Update frequencies
status
Service types
Scale
Resolution
-
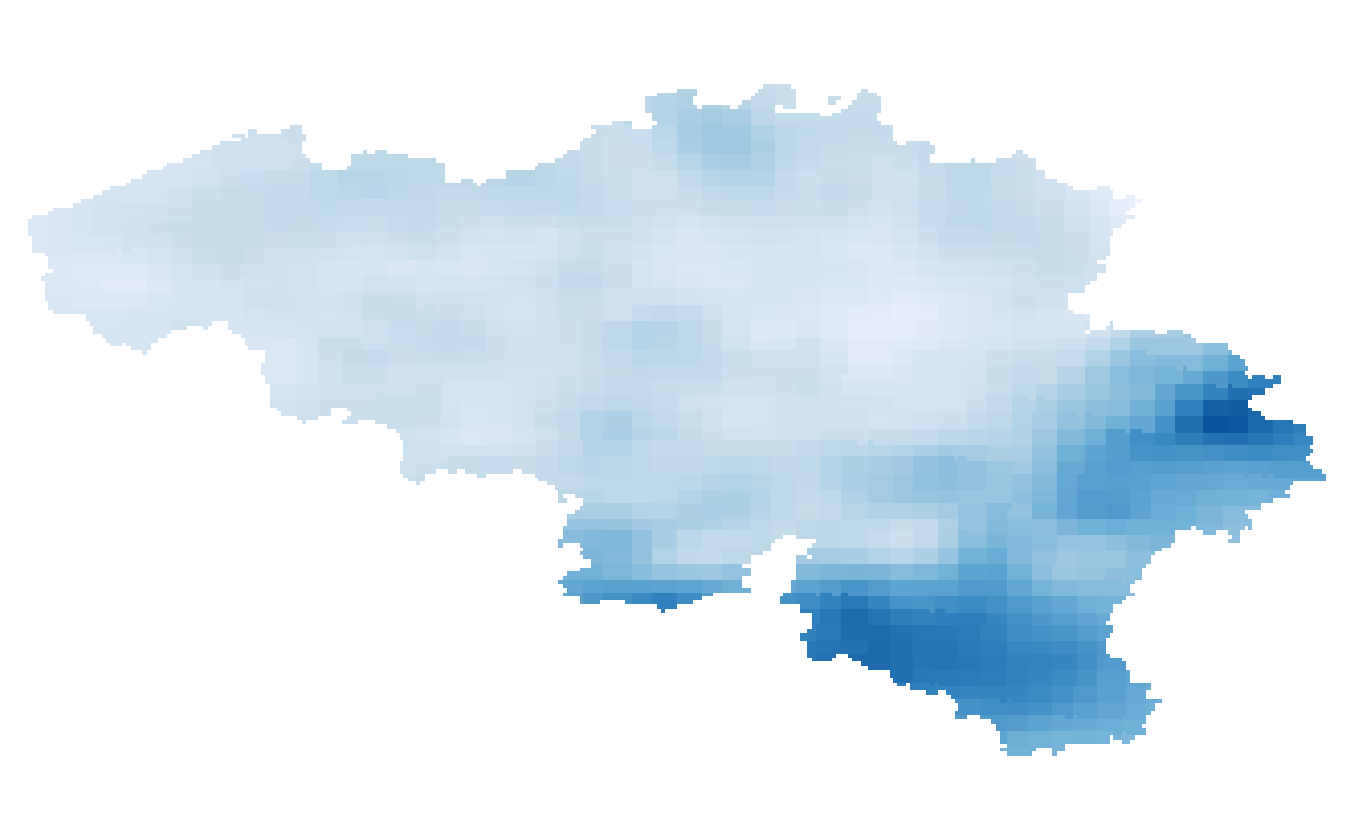
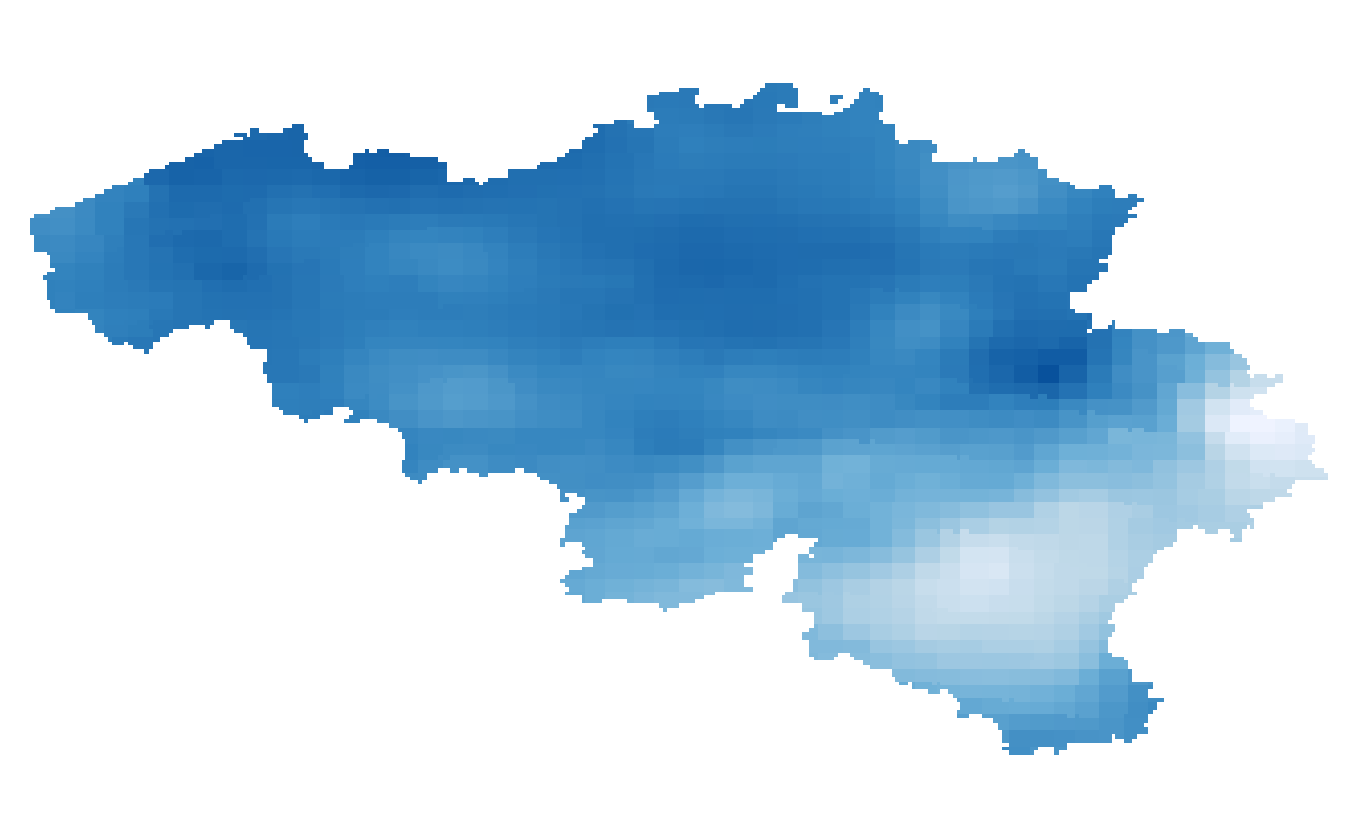
Annual, seasonal and monthly precipitation amounts given in respectively mm/year, mm/3 months and mm/month. The precipitation amounts are available for the present target year 1975, which corresponds to the middle of the 30-year period 1961-1990.
-
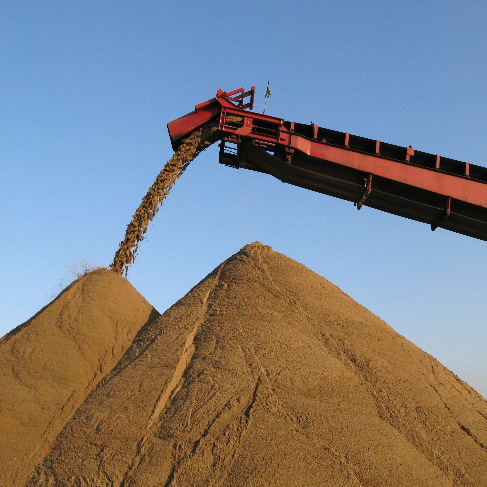
The dataset shows in the form of polygons the sand and gravel extraction sites in the Belgian marine areas as defined by the successive marine spatial plans. A 2014 version illustrates the 2014-2020 plan while the 2020 version illustrates the 2020-2026 plan.
-
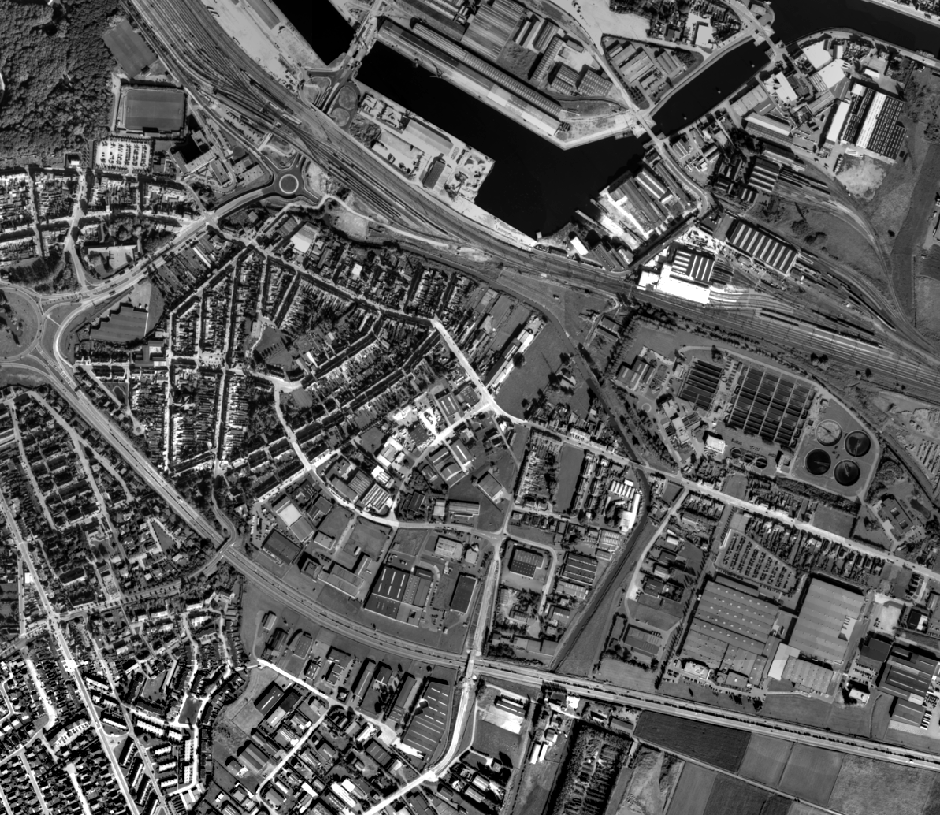
This dataset contains historical orthophoto mosaics based on available aerial photographs covering parts of the Belgian territory. Orthophotos are aerial photographs that have been geometrically corrected (orthorectified) to eliminate distortions caused by terrain relief, lens distortion, and camera tilt. Unlike raw aerial imagery, orthophotos have a uniform scale and accurate geometry, making them suitable for cartography, measurements, and visual analysis. This specific dataset includes historical orthophotos from 1989, derived from aerial surveys carried out by the National Geographic Institute (NGI). During this period, only analogue aerial photographs are available. The analogue images were scanned at high resolution and orthorectified. The resulting orthophotos were assembled into mosaics and georeferenced in the Lambert 2008 coordinate system. All orthophotos are panchromatic (black and white). The ground resolution (GSD) is 10 cm. The spatial coverage of this dataset is limited to the areas for which aerial photographs were available during the mentioned period. The data can be visualized via the corresponding web services (WMS/WMTS). The orthophotos and the original aerial photographs can be ordered in high resolution via https://shop.ngi.be/nl/luchtfotos/.
-
This dataset contains historical orthophoto mosaics based on available aerial photographs covering parts of the Belgian territory. Orthophotos are aerial photographs that have been geometrically corrected (orthorectified) to eliminate distortions caused by terrain relief, lens distortion, and camera tilt. Unlike raw aerial imagery, orthophotos have a uniform scale and accurate geometry, making them suitable for cartography, measurements, and visual analysis. This specific dataset includes historical orthophotos from 2000, 2001, 2002, 2003, 2004, 2005, 2006, 2007, 2008, and 2009, derived from aerial surveys carried out by the National Geographic Institute (NGI) and the Regions. From this period onward, both analogue and digital aerial photographs are available. The analogue images were scanned at high resolution and, like the digital ones, orthorectified. The resulting orthophotos were assembled into mosaics and georeferenced in the Lambert 2008 coordinate system. The orthophotos are either panchromatic (black and white) or in colour (RGB), depending on the year and location. The ground resolution (GSD) varies between 10 cm and 100 cm, depending on the sensor used and the surveyed area. The spatial coverage of this dataset is limited to the areas for which aerial photographs were available during the mentioned period. The data can be visualized via the corresponding web services (WMS/WMTS). The orthophotos and the original aerial photographs can be ordered in high resolution via https://shop.ngi.be/nl/luchtfotos/.
-
This dataset contains historical orthophoto mosaics based on available aerial photographs covering parts of the Belgian territory. Orthophotos are aerial photographs that have been geometrically corrected (orthorectified) to eliminate distortions caused by terrain relief, lens distortion, and camera tilt. Unlike raw aerial imagery, orthophotos have a uniform scale and accurate geometry, making them suitable for cartography, measurements, and visual analysis. This specific dataset includes historical orthophotos from 2010, 2011, 2012, 2013, 2014 and 2015, derived from aerial surveys carried out by the National Geographic Institute (NGI) and the Regions. During this period, both analogue and digital aerial photographs are available. The analogue images were scanned at high resolution and, like the digital ones, orthorectified. The resulting orthophotos were assembled into mosaics and georeferenced in the Lambert 2008 coordinate system. All orthophotos are in colour (RGB). The ground resolution (GSD) varies between 10 cm and 50 cm, depending on the sensor used and the surveyed area. The spatial coverage of this dataset is limited to the areas for which aerial photographs were available during the mentioned period. The data can be visualized via the corresponding web services (WMS/WMTS). The orthophotos and the original aerial photographs can be ordered in high resolution via https://shop.ngi.be/nl/luchtfotos/.
-
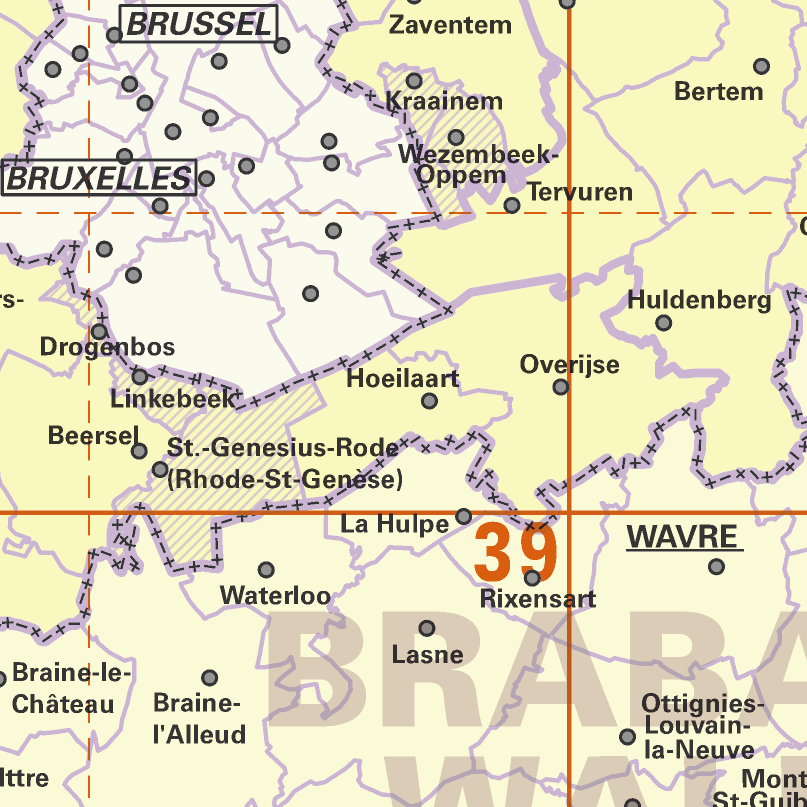
AdminMap is the digital version of the administrative map. Two versions exist: the most complete one on the scale of 1:300 000 and a simplified version on the scale of 1:500 000. These maps show the different administrative units on the Belgian territory, from the federal State to the center of the districts for the 1:500 000. The map also shows the map grid of the National Geographic Institute. An index allows localizing the different units. The index also contains information on the linguistic statutes and on the postal codes.
-
Annual, summer and winter mean potential evapotranspiration given in respectively mm/year and mm/3 months and based on the Penman-Monteith definition. The potential evapotranspiration fields are available for the future target year 2085, which corresponds to the middle of the 30-year period 2071-2100, and for mean and high impact scenarios corresponding respectively to the 50th and 95th percentiles of the change factors.
-

The DTM 1m, digital terrain model at 1m-resolution, is a homogeneous and regular point grid indicating the height of the ground level in order to model its surface, without taking into account objects on the surface such as buildings and vegetation. DTM 1m is achieved by interpolating in Lambert 2008 source data in Lambert 72 and at a 1m-resolution from the Flemish (2013-2015) and Brussels (2021) Regions, and by adding Lambert 2008 data at 1m-resolution from the Walloon Region (2021-2022).
-

This AtomFeed download service provides access to federal datasets that are not reported under the INSPIRE Directive. The datasets can be accessible for free or under conditions.
-
This dataset contains historical orthophoto mosaics based on available aerial photographs covering parts of the Belgian territory. Orthophotos are aerial photographs that have been geometrically corrected (orthorectified) to eliminate distortions caused by terrain relief, lens distortion, and camera tilt. Unlike raw aerial imagery, orthophotos have a uniform scale and accurate geometry, making them suitable for cartography, measurements, and visual analysis. This specific dataset includes historical orthophotos from 1960, 1961, 1966 and 1969, derived from aerial surveys carried out by the National Geographic Institute (NGI). During this period, only analogue aerial photographs are available. The analogue images were scanned at high resolution and orthorectified. The resulting orthophotos were assembled into mosaics and georeferenced in the Lambert 2008 coordinate system. All orthophotos are panchromatic (black and white). The ground resolution (GSD) varies between 10 cm and 50 cm, depending on the sensor used and the surveyed area. The spatial coverage of this dataset is limited to the areas for which aerial photographs were available during the mentioned period. The data can be visualized via the corresponding web services (WMS/WMTS). The orthophotos and the original aerial photographs can be ordered in high resolution via https://shop.ngi.be/nl/luchtfotos/.