 geo.be Metadata Catalog
climatologyMeteorologyAtmosphere
Type of resources
Available actions
Topics
INSPIRE themes
federalThemes
Keywords
Contact for the resource
Provided by
Years
Formats
Representation types
Update frequencies
status
Scale
Resolution
-
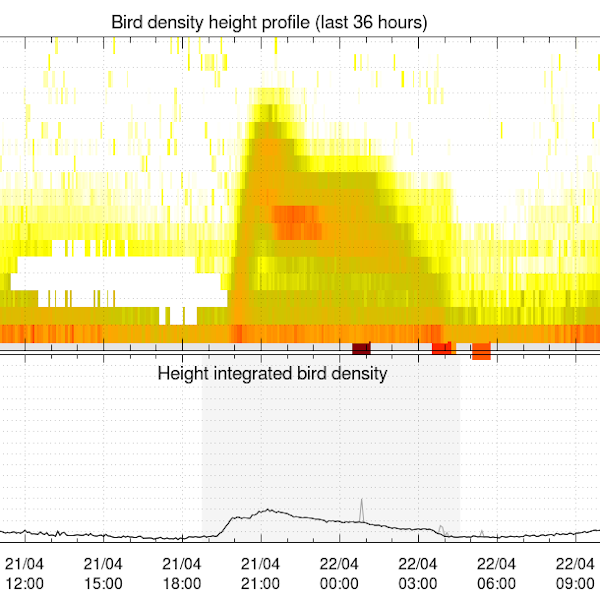
Bird density profiles are derived from weather radar volume data in real time, by the vol2bird algorithm as described in Dokter et al. (2011, 2019). The vol2bird algorithm exploits the radar reflectivity characteristics of different scatterers in the atmosphere, in order to distinguish biological from non-biological radar echoes. Once biological scatterers are isolated in the volume files, the reflectivity of these scatterers is converted in an estimate of the bird density per vertical layer of 200m, using a mean cross section of 11 cm2. The vbird profiles are provided for the following radars, with the radar owner in parentheses: Jabbeke (RMI), Wideumont (RMI), Helchteren (VMM), Zaventem (Skeyes), Herwijnen (KNMI), Den Helder (KNMI), Neuheilenbach (DWD), Essen (DWD), Abbeville (Météo-France) and Avesnois (Météo-France). References: - Dokter A.M., Liechti F., Stark H., Delobbe L., Tabary P., Holleman I., Bird migration flight altitudes studied by a network of operational weather radars, J. R. Soc. Interface, 8, 30–43, 2011, DOI 10.1098/rsif.2010.0116 - Dokter A.M., Desmet P., Spaaks J.H., van Hoey S., Veen L., Verlinden L., Nilsson C., Haase G., Leijnse H., Farnsworth A., Bouten W., Shamoun-Baranes J., bioRad: biological analysis and visualization of weather radar data, Ecography, 42, 852-860, 2019, DOI 10.1111/ecog.04028
-

From multiple observations during the day with UV spectrophotometers a daily value of the ozone column is calculated. This product is not publically available yet.
-
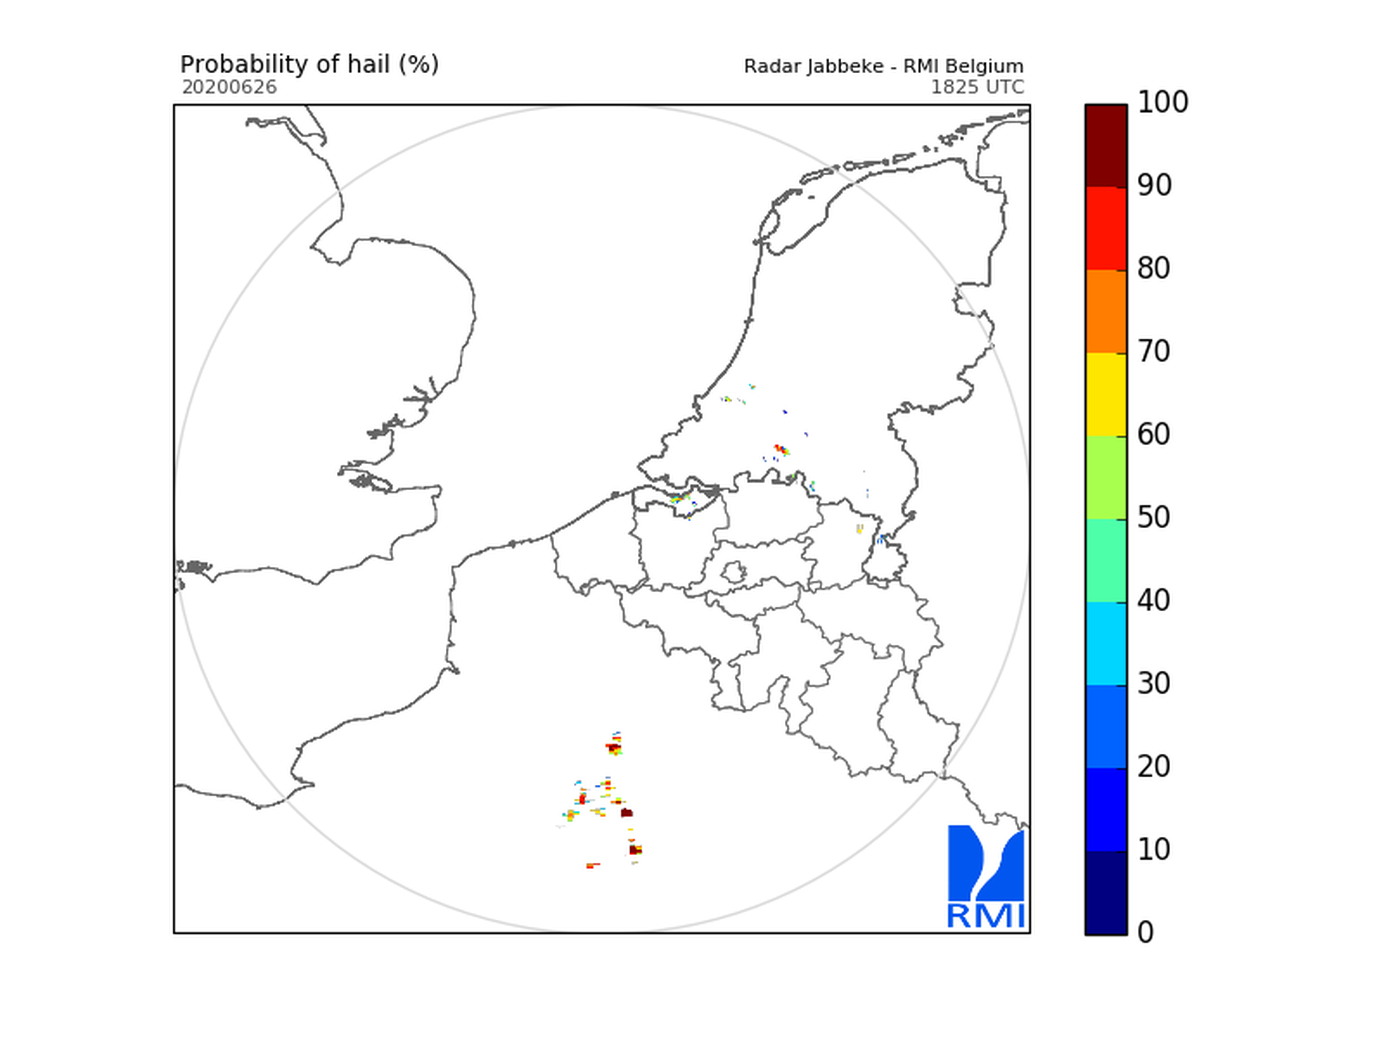
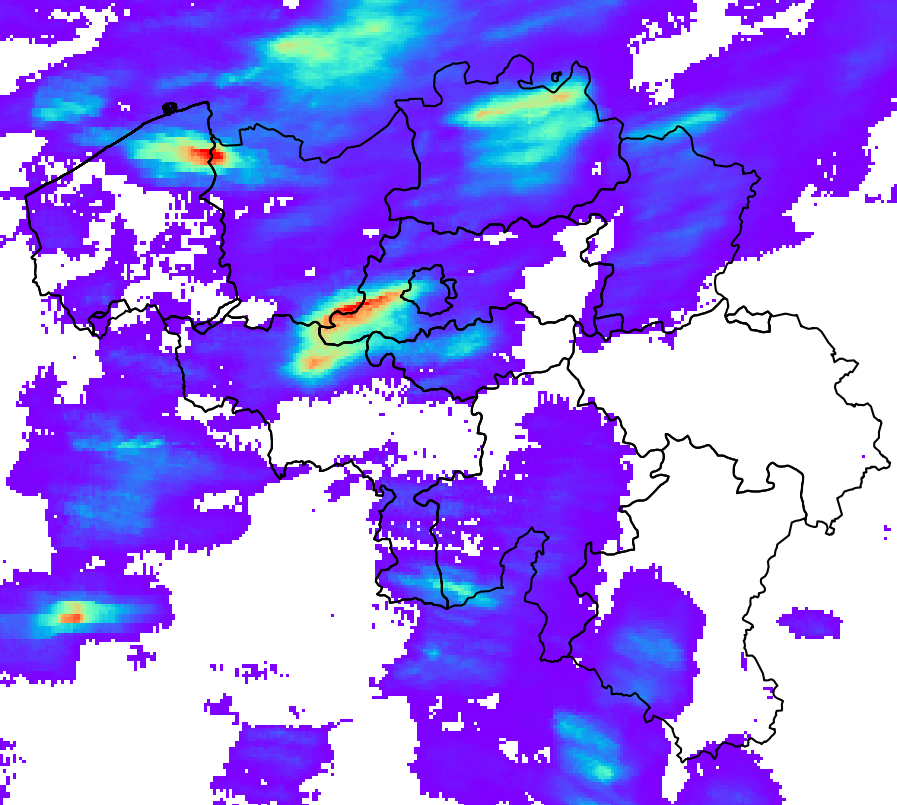
Hail products are derived from the observed vertical profiles of radar reflectivity and the NWP vertical profiles of temperature. Three types of products are generated. poh : probability of hail of any size (larger than 0.5 cm diameter)expressed in %. posh : probability of severe hail(larger than 2cm)expressed in %. mesh : maximum expected size of hailexpressed in mm of hailstone diameter. All products are generated every 5 minutes. This product is not publically available yet.
-
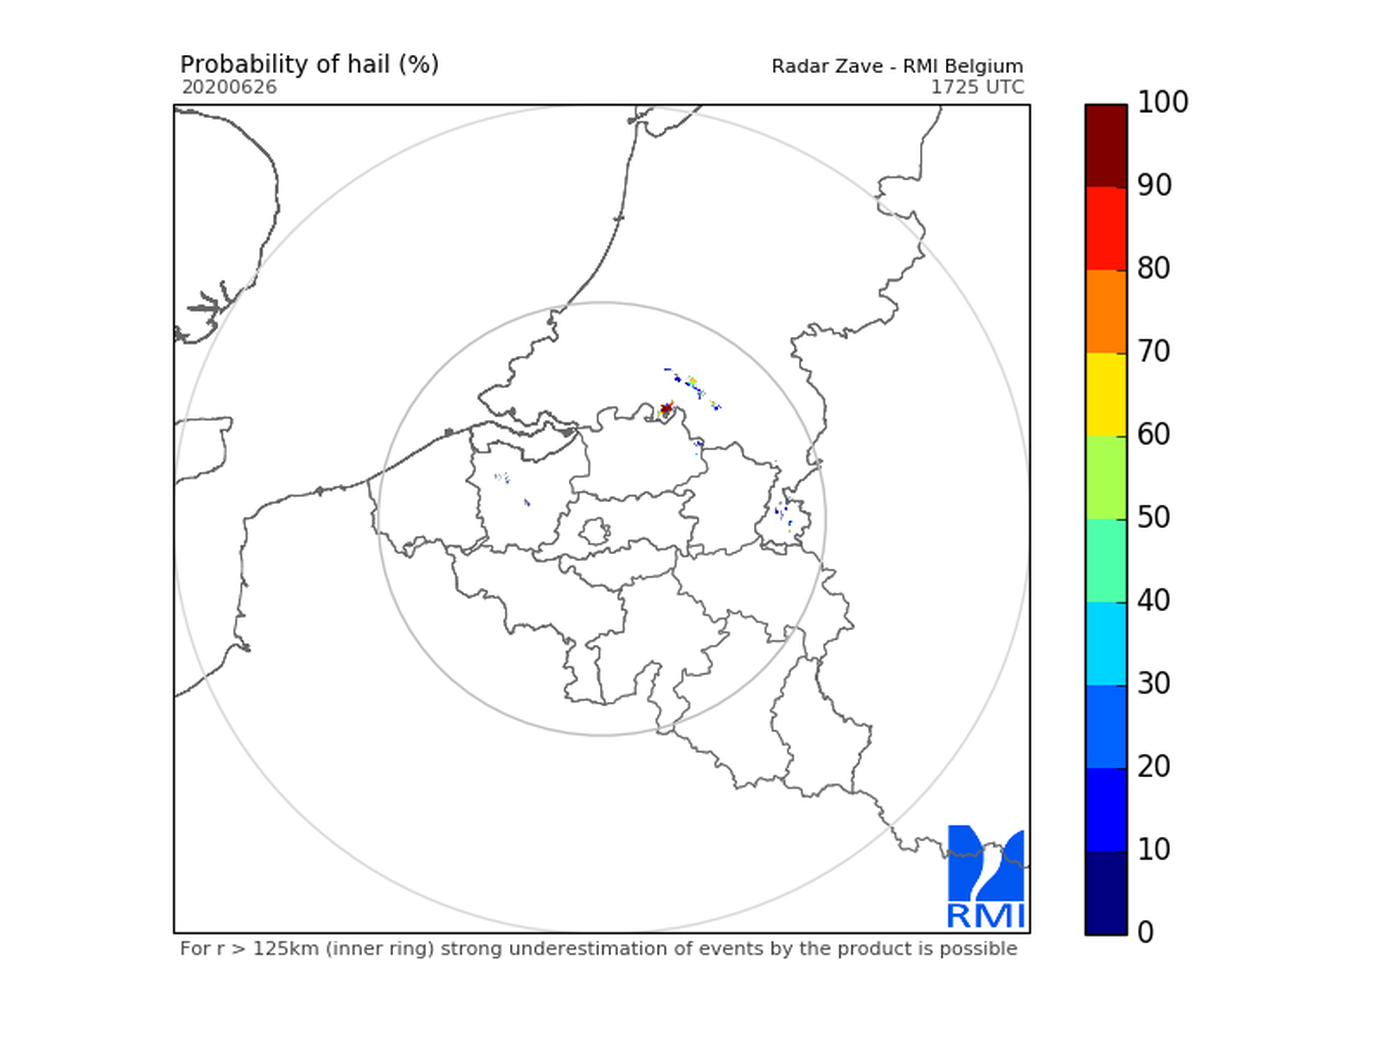
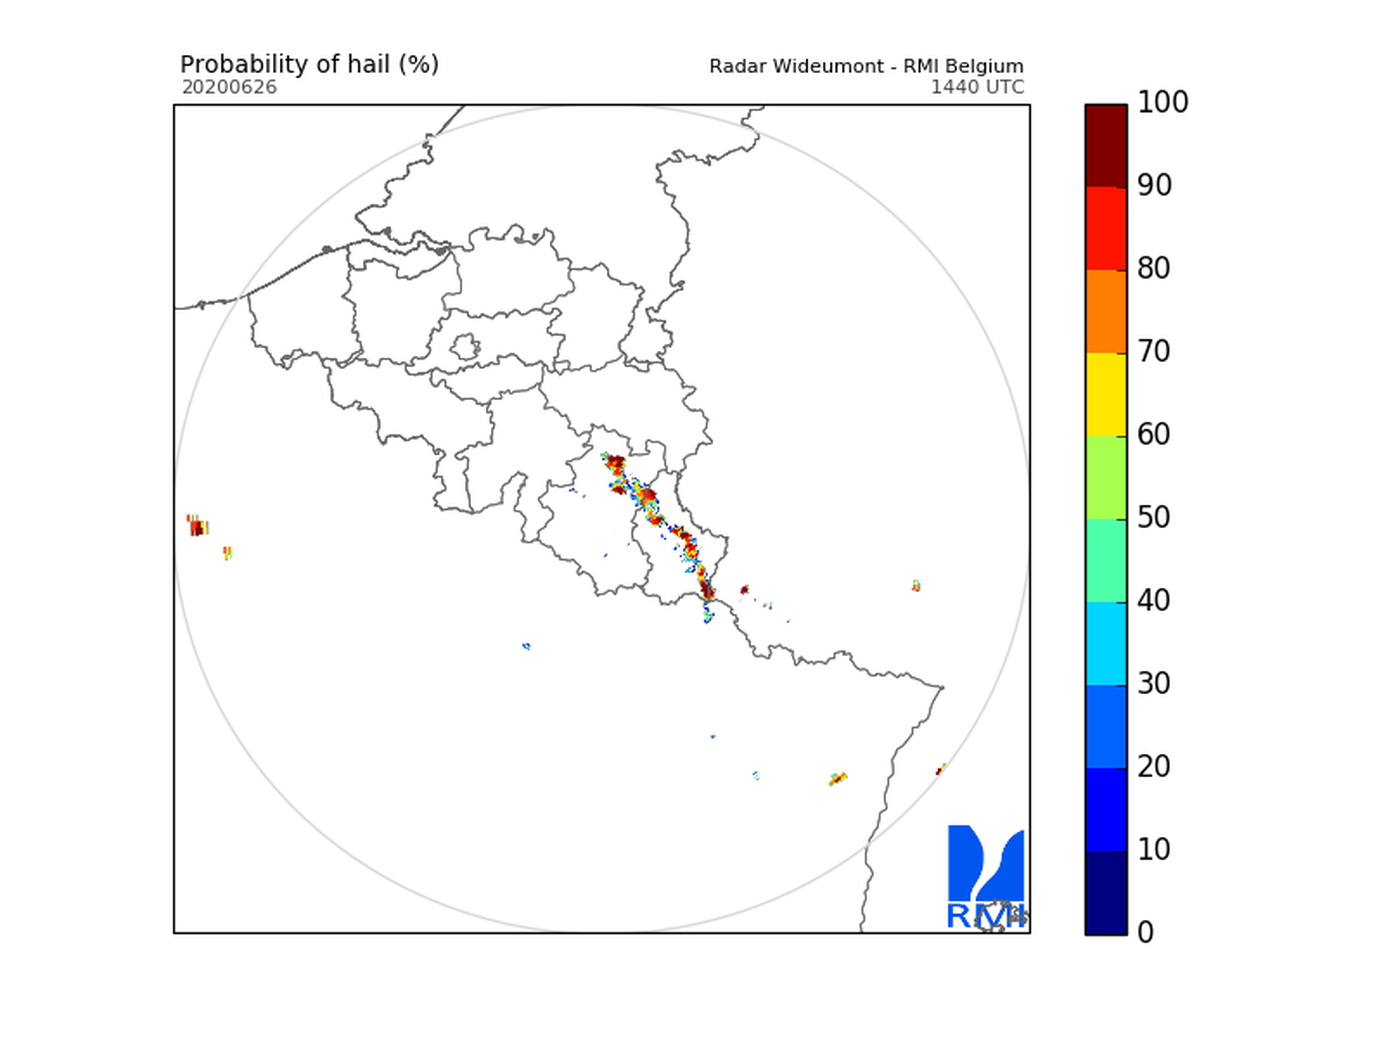
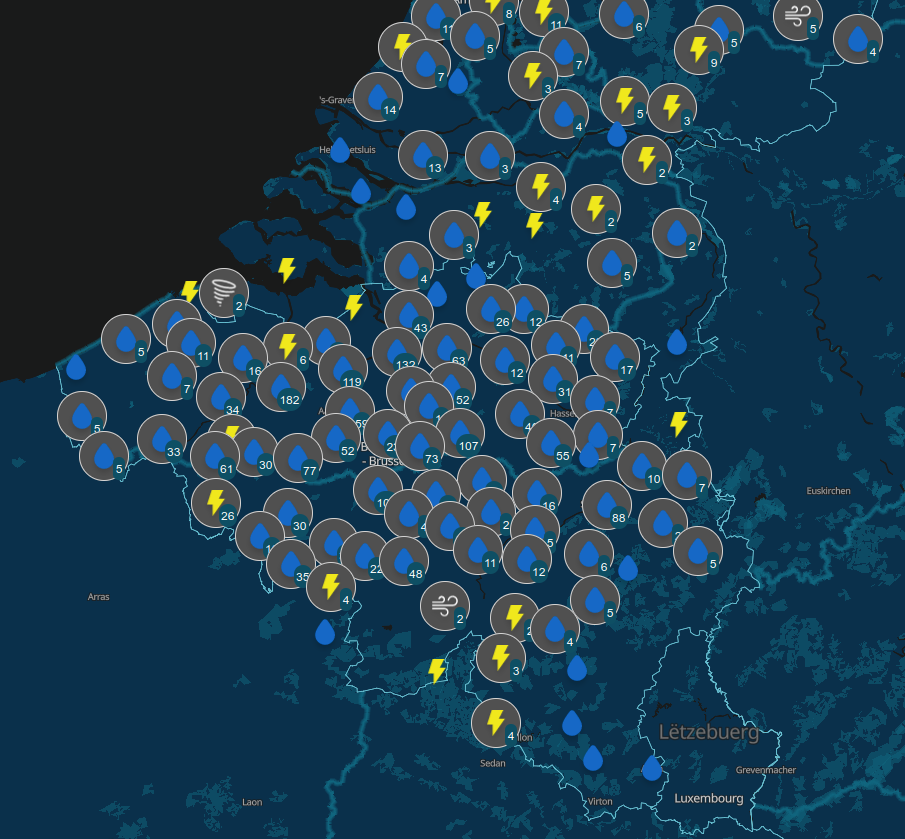
Since August 2019, users of the RMI smartphone app are able to send an observation of the meteorological conditions at a certain place and a certain time. The observations provide information about the weather conditions and potentially severe weather to the other users and to RMI. The collection of citizen weather reports is a valuable complement to the information obtained with the classical instruments like stations, radar and satellite. The data can be exploited for nowcasting, warnings and model verification, and eventually in assimilation. A general introduction of the data and their characteristics can be found in Reyniers et al. (2023). A basic quality control is implemented on the received observations via a plausibility check. This plausibility check determines whether an observation is plausible, suspicious or false, by comparing it to the INCA-BE nowcasting system using a simple thresholding scheme. INCA-BE is RMI's operational nowcasting system described in Reyniers et al. (2021). There is no strict spatial extent since there is no restriction at the input side: users can send observations from all over the globe. The bulk of the observations are received from within Belgium. Note that the plausibility check is not available for reports from outside Belgium.
-
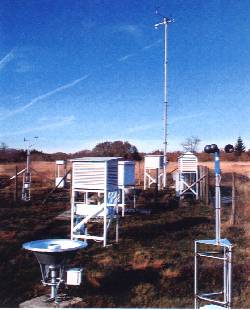
The SYNOP data of RMI contain the observations of the synoptic network, currently consisting of 29 stations, 13 of which are owned by RMI. The other stations belong to MeteoWing (8 stations), Skeyes (7 stations). There is also 1 foreign station. All SYNOP data is given in Universal Time! (local time winter = UT +1; local time summer = UT + 2) Parameters: 1. Precipitation: PRECIP_QUANTITY + PRECIP_RANGE 2. Temperature: TEMP + TEMP_MIN + TEMP_MAX + TEMP_GRASS_MIN 3. Wind: WIND_SPEED + WIND_SPEED_UNIT + WIND_DIRECTION + WIND_PEAK_SPEED 4. relative humidity: HUMIDITY_RELATIVE 5. weather type: WEATHER_CURRENT 6. air pressure: PRESSURE of PRESSURE_STATION_LEVEL 7. sunshine duration: SUN_DURATION_24H 8. Global radiation: SHORT_WAVE_FROM_SKY_24HOUR 9. Total cloudiness: CLOUDINESS
-
RADQPE provides high resolution radar-based quantitative precipitation estimation in realtime for Belgium and its surroundings. This product is not publically available yet.
-
Daily forecasts for each belgian commune, from current day up to the next 7 days. This product is not publically available.
-
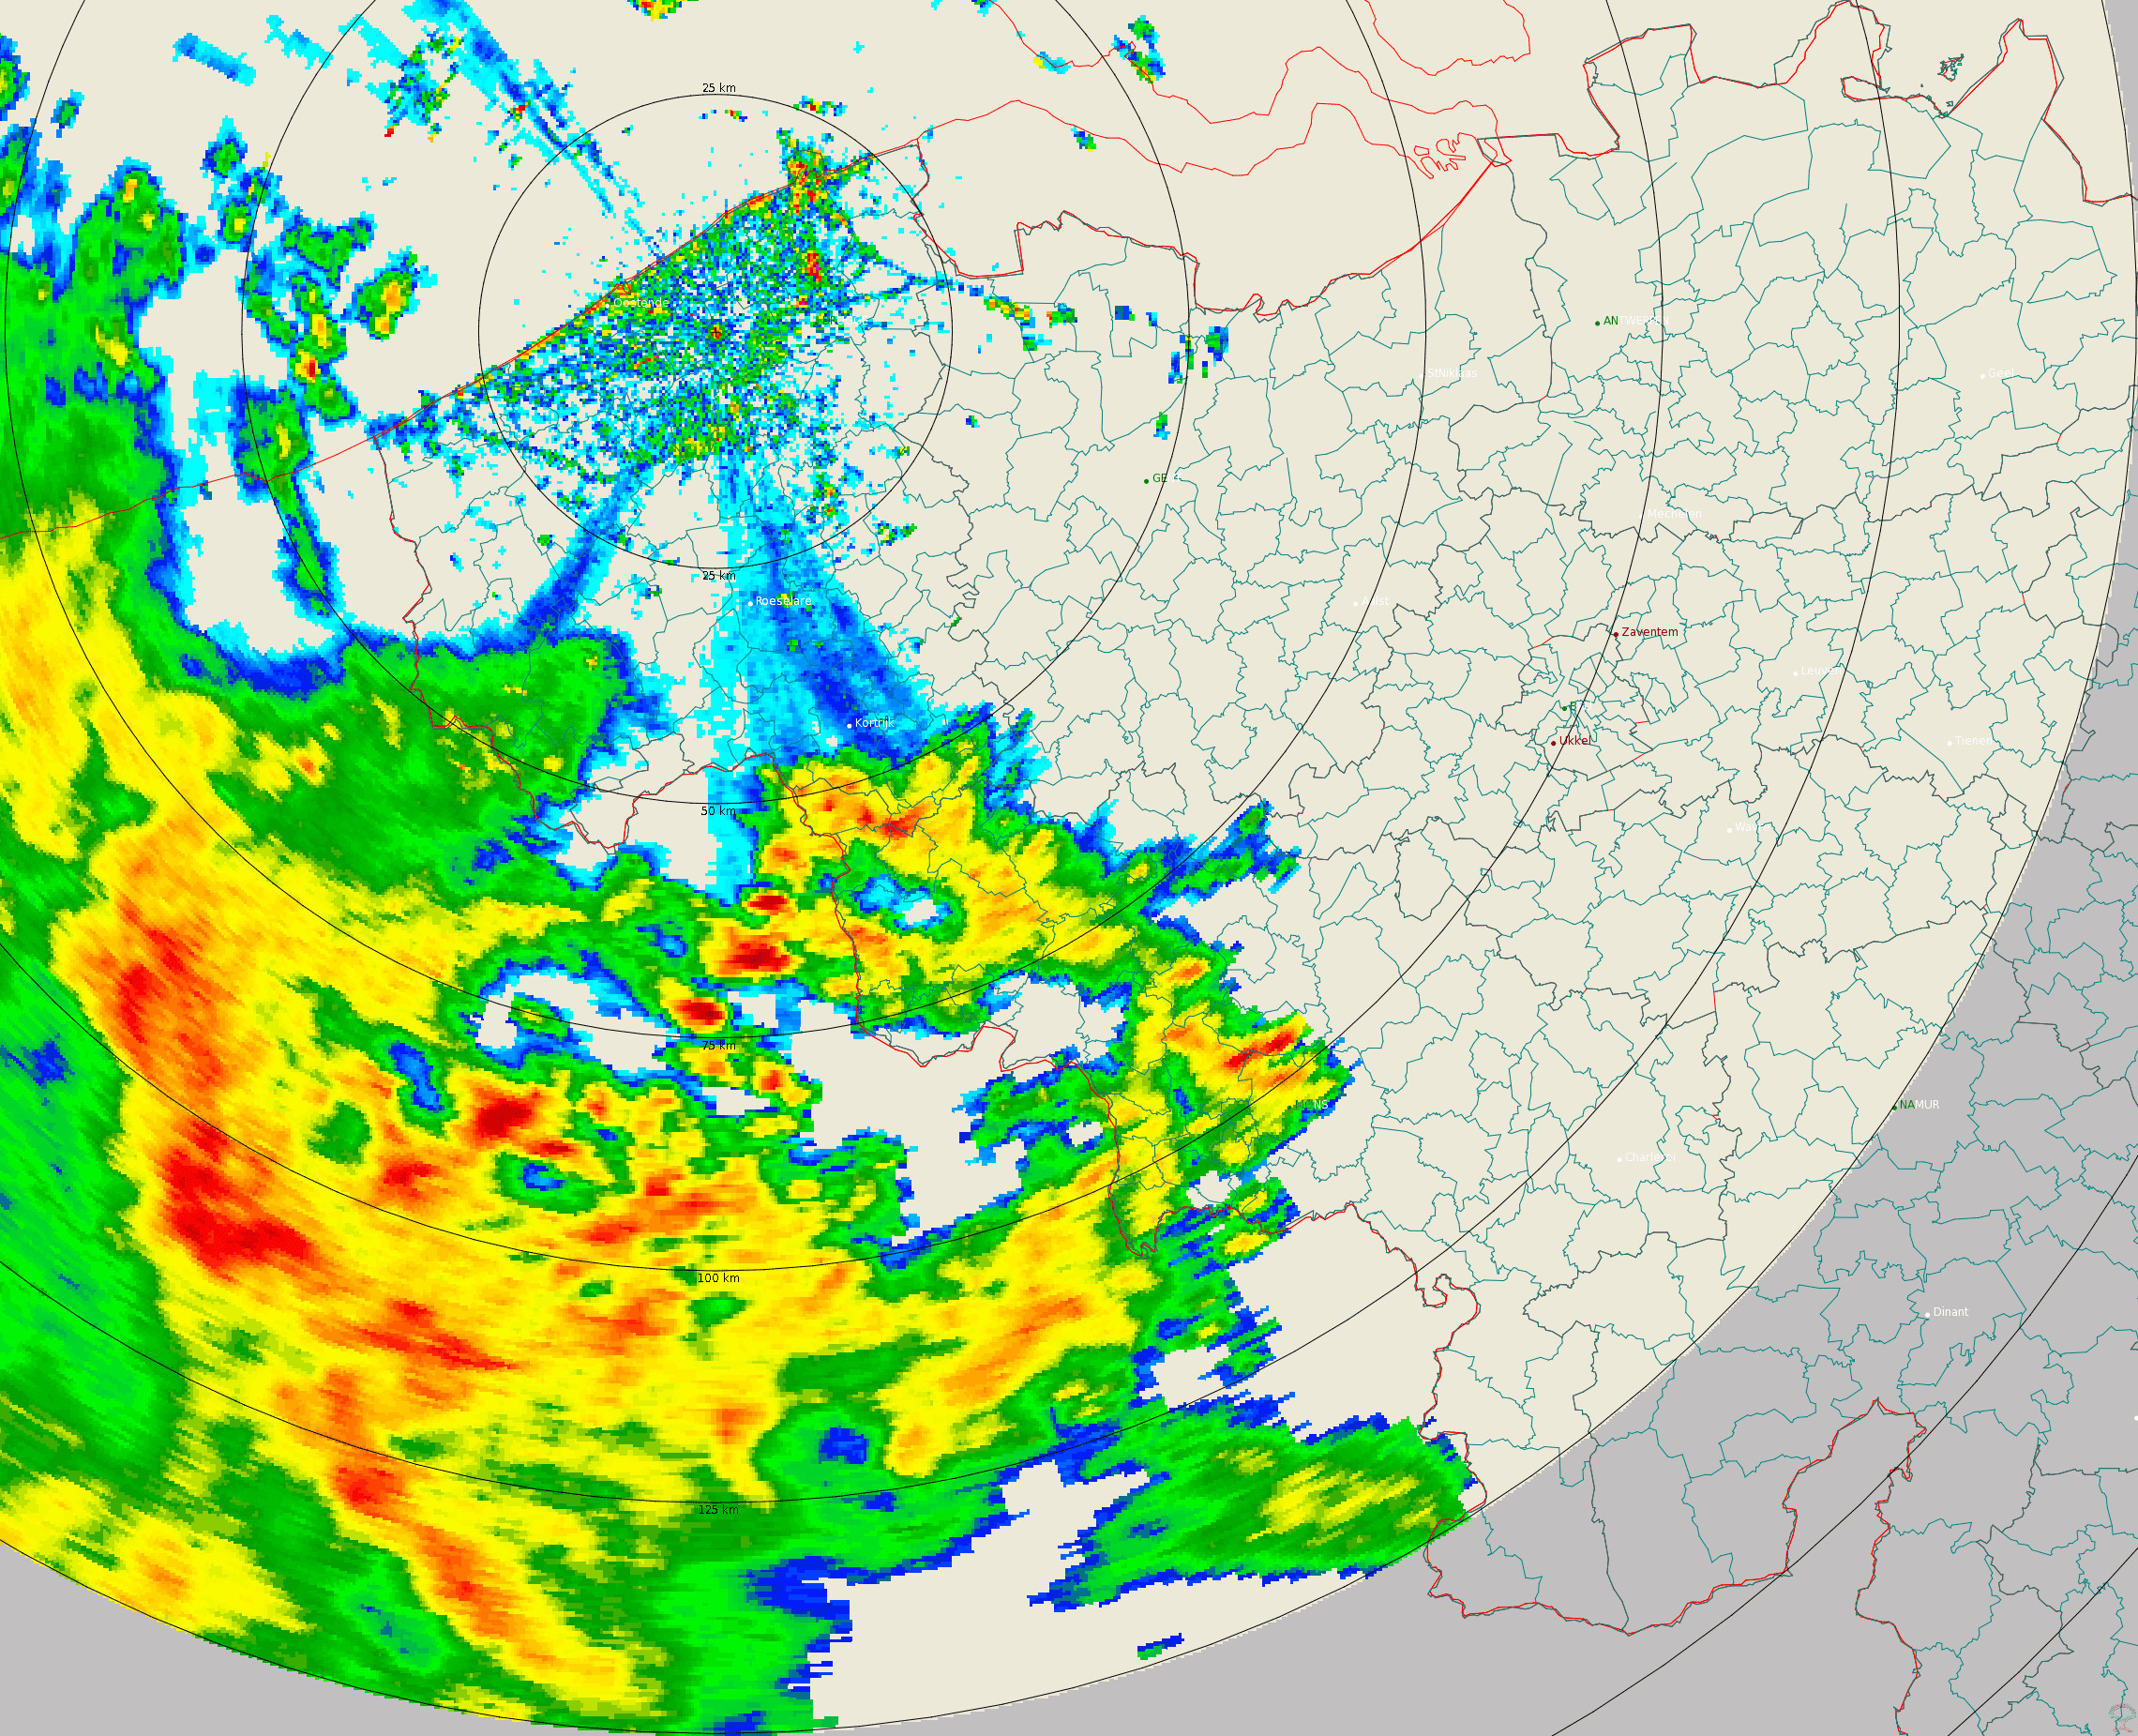
Polar volume reflectivity data from the Jabbeke weather radar. Volume data files are produced every 5 minutes from a multiple elevation scan. This product is not publicly available yet.