Oceans
Type of resources
Topics
INSPIRE themes
Keywords
Contact for the resource
Provided by
Years
Formats
Representation types
-
Beach Litter count data collected across 10 beaches of the Belgian coast in 2023 and 2024 by volunteers of the citizen science association Proper Strand Lopers. One of the key indicators of abundance, composition and trends of litter in the marine environment is the amount on beaches. OSPAR monitors litter on 100m stretches at over 70 beaches in the North-East Atlantic following common monitoring guidelines. The monitoring records litter in 112 predefined litter items in 11 types: Plastic / polystyrene, Metal, Paper and cardboard, Wood, Sanitary waste, Cloth, Rubber, Glass, Pottery/ceramics, Medical waste and Faeces.
-
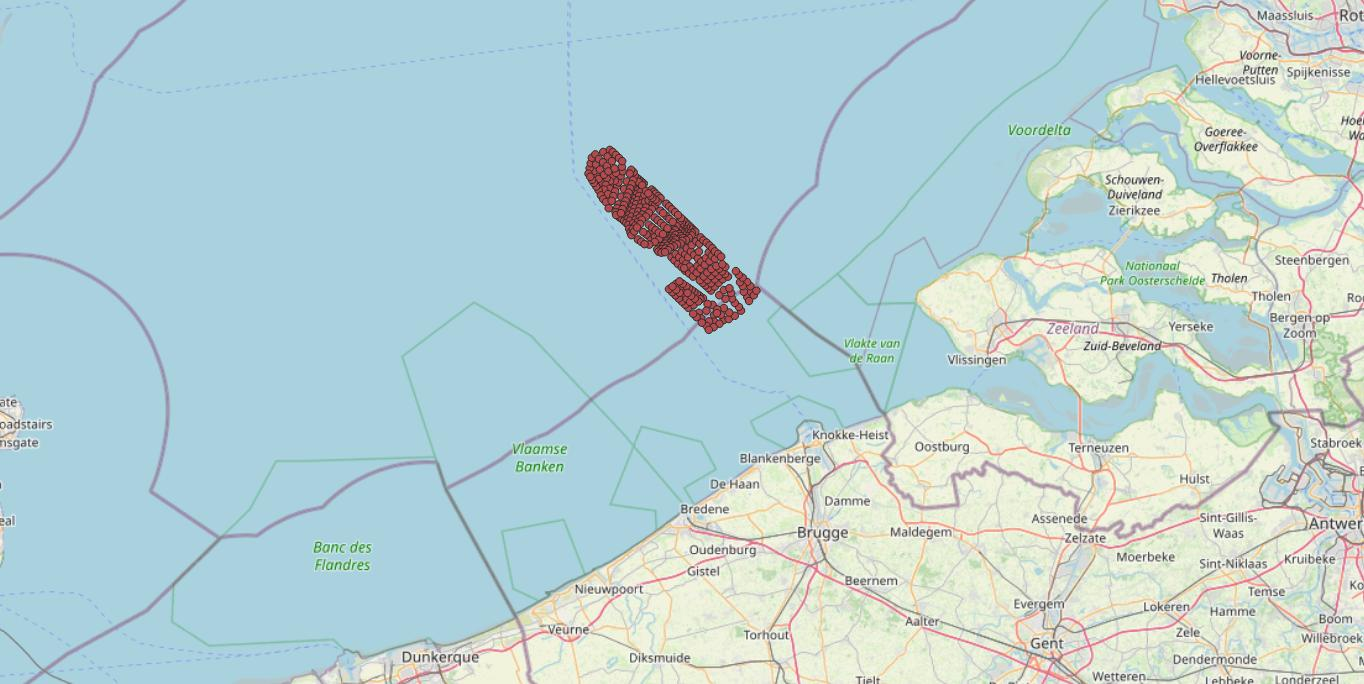
This dataset represents the location of the Princess Elizabeth zone in the Belgian Part of the North Sea as described in the Royal Decree of May 22th, 2019, establishing a marine spatial plan for the period 2020-2026. Art. 8. § 3.
-
This dataset represents main data about the cores of Belgian boreholes that are stored by the Royal Belgian Institute of Natural Sciences. Data is distributed as shapefile with multiple meta-infomations such as unique borehole reference, depth, location, lithology and a link to access the core and lithological descriptions.
-

This dataset is part of the 2018 Belgian submission for the Marine Strategy Framework Directive (MSFD) linked to descriptor 1, criterion 3. Occurrence of breeding seabirds describes the observation of eight seabird species (Common tern, Black-headed Gull, Herring Gull, Common Gull, Small Black-backed Gull, Yellow-legged gull, Big Stern and Little Stern) on the Belgian coast between 1992 and 2015.
-
UNDER EMBARGO - This dataset contains seasonal physiological measurements from controlled laboratory experiments on two dominant suspension-feeding species expected to colonise floating offshore structures: the blue mussel (Mytilus edulis; AphiaID 140480) and the wrinkled barnacle (Balanus crenatus; AphiaID 106215). The measured parameters include clearance rates, respiration rates, faecal pellet production rates, and faecal pellet sinking velocities. Mussels were collected from an aquaculture longline at the Westdiep SeaFarm, while barnacles were manually retrieved from the intertidal beachhead at Raversijde (Oostende, Belgium). All experiments were conducted using natural seawater collected from offshore sites in the Belgian part of the North Sea. Measurements were repeated across multiple seasons to capture temporal variability in physiological performance. The dataset was produced within the SWiM and EcoMPV projects and is suitable for reuse in ecosystem and biogeochemical modelling, including simulations of phytoplankton dynamics associated with large-scale offshore marine photovoltaic (MPV) developments.
-

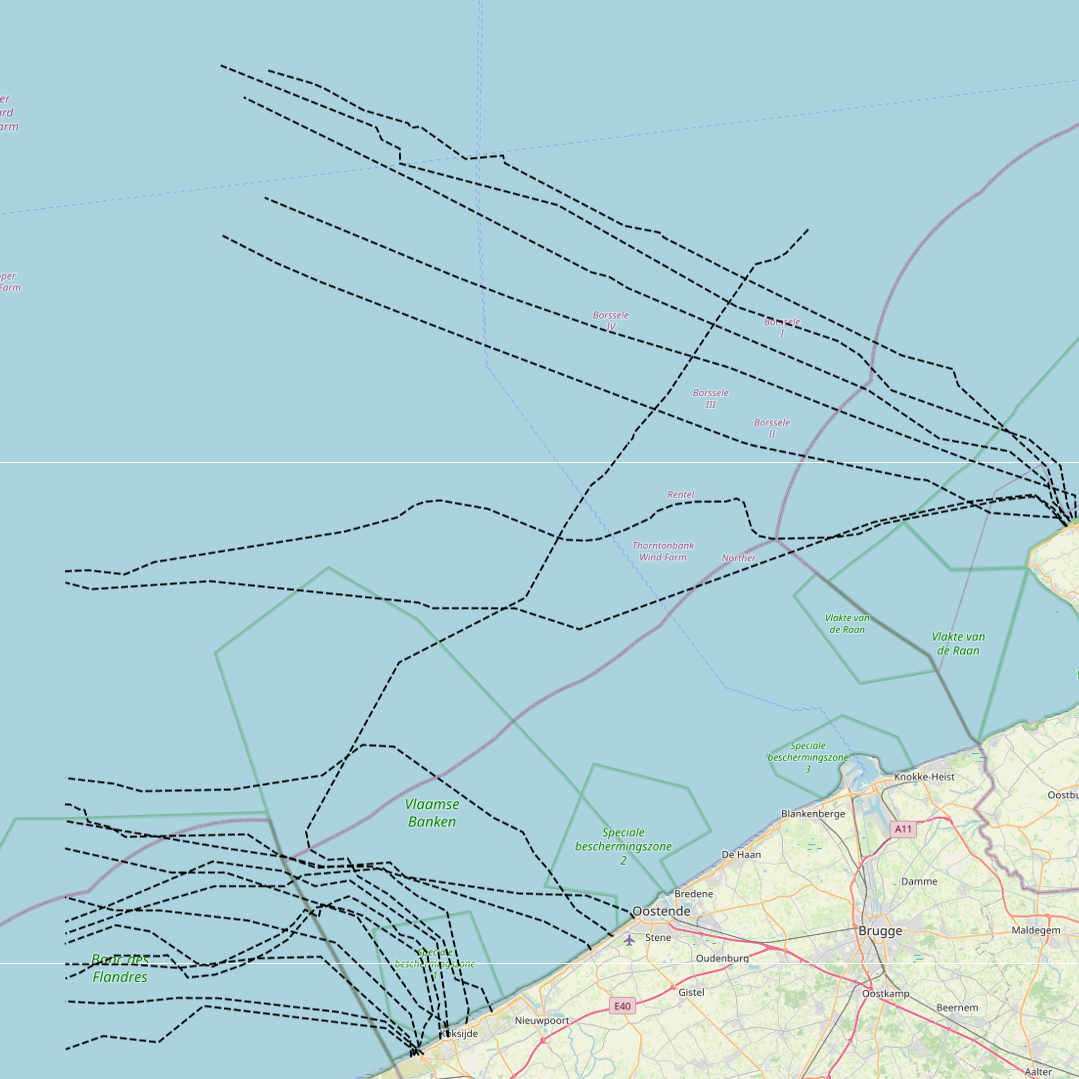
This dataset represents the exact location of disused telecommunication cables installed in the Belgian Part of the North Sea.
-

This dataset is part of the 2018 Belgian submission for the Marine Strategy Framework Directive (MSFD) linked to descriptor 1, criterion 1. Stranded porpoises often show traces of incidental catch in fishing nets (bycatch), a major cause of death for this cetacean in the North Sea. Based on the number of stranded animals showing traces of bycatch, it can be estimated that up to a few dozen porpoises are caught per year. For extrapolation of bycatch data to effects at population level, reference is made to (future) initiatives at regional level.
-

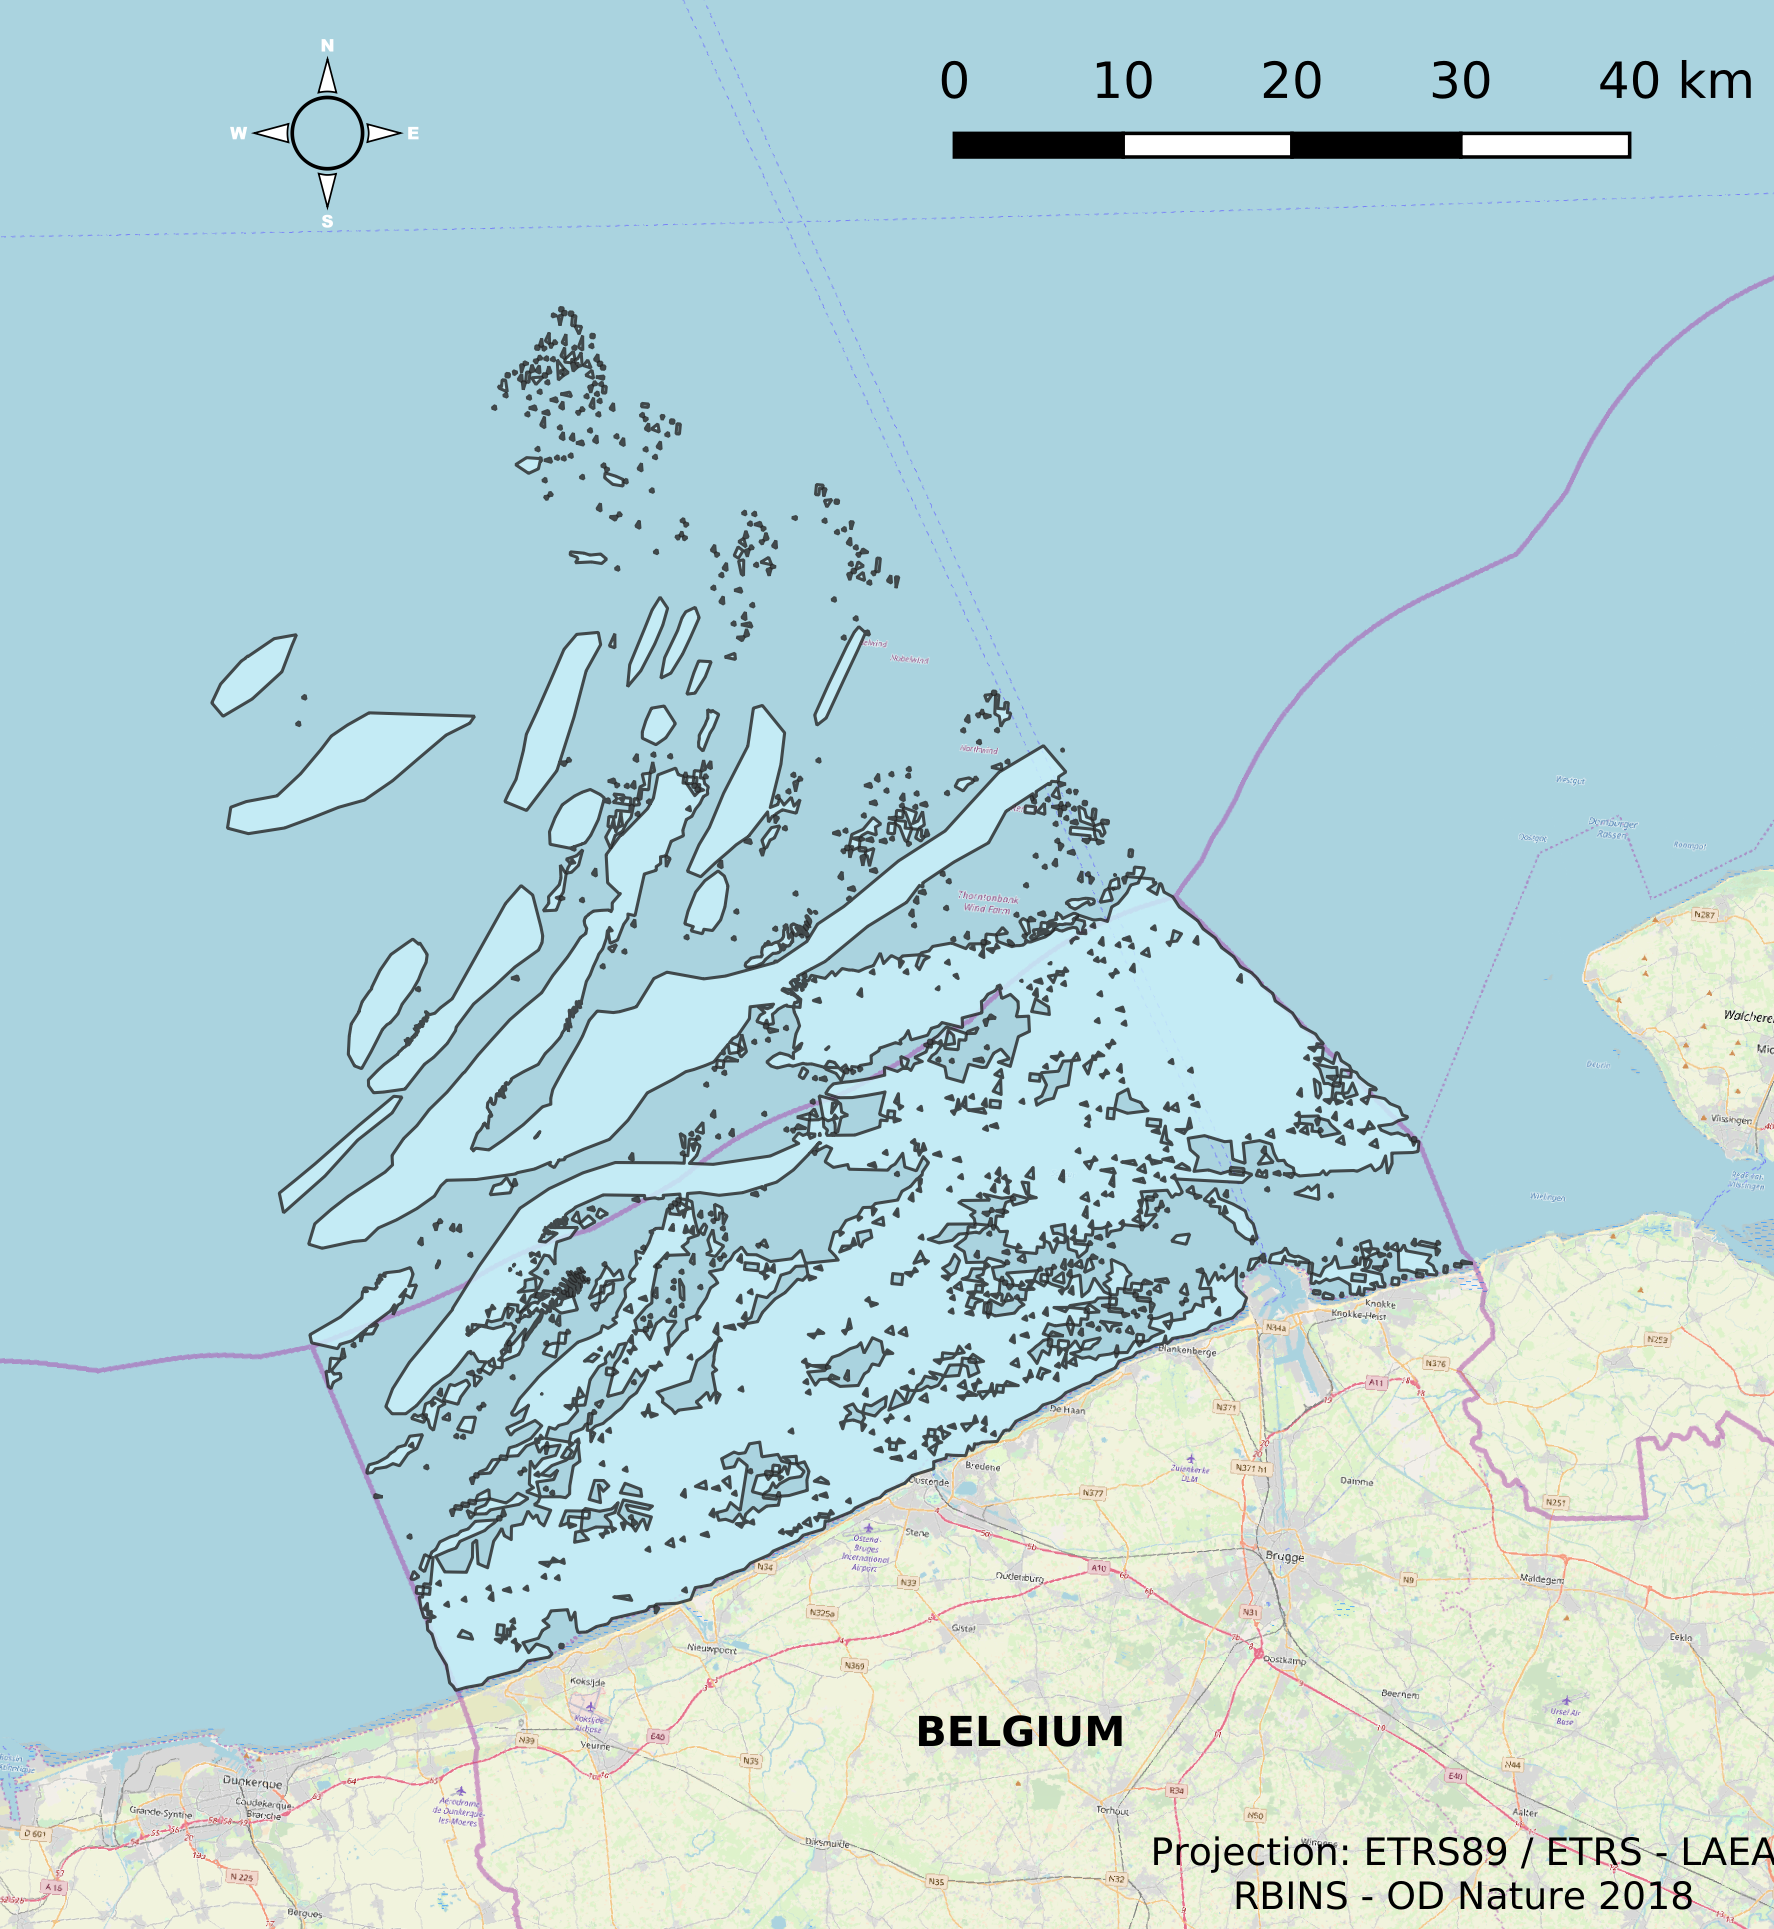
This dataset describes the extents and location of Reefs in the Belgian Part of the North Sea (BPNS) as required for article 17 of the Council Directive 92/43/EEC of 21 May 1992 on the conservation of natural habitats and of wild fauna and flora. The Council Directive seeks to contribute to ensuring biodiversity in the European Union by the conservation of natural habitats and wild fauna and flora species.
-
This datasets is a summary of the CTD profiles measured with the RV Belgica. It provides general meta-information such as the campaign code, the date of measurement and the geographical information. An important information is the profile quality flag that describes the validity of the data. A quality flag = 2 means the data is generally good although some outliers can still be present. A quality flag = 4 means the data should not be trusted. 1 meter binned data can be download on the SeaDataNet CDI portal (enter the cruise_id in the search bar) ONLY for the good quality profiles. Full acquisition frequency datasets are available on request to BMDC.
-

This dataset represents the exact location of the wind turbines in the Belgian Part of the North Sea.
 geo.be Metadata Catalog