 geo.be Metadata Catalog
2016
Type of resources
Available actions
Topics
INSPIRE themes
federalThemes
Keywords
Contact for the resource
Provided by
Years
Formats
Representation types
Update frequencies
status
Scale
Resolution
-
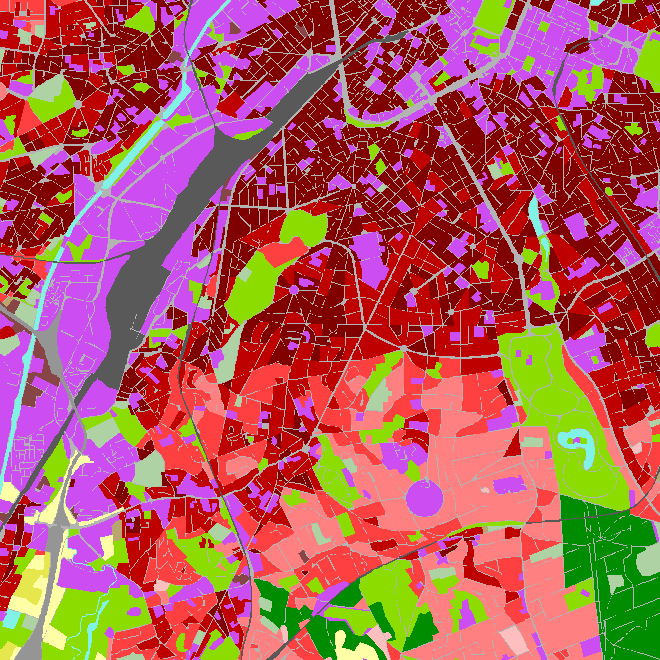
The European Urban Atlas provides reliable, inter-comparable, high-resolution land use and land cover data for 800 Functional Urban Area (FUA) for the 2012 reference year in EEA39 countries. This datasets contains the FUA for Belgium (Antwerpen, Brugge, Bruxelles_Brussel, Charleroi, Gent, Kortrijk, Leuven, Liege, Mons, Namur and Oostende).
-
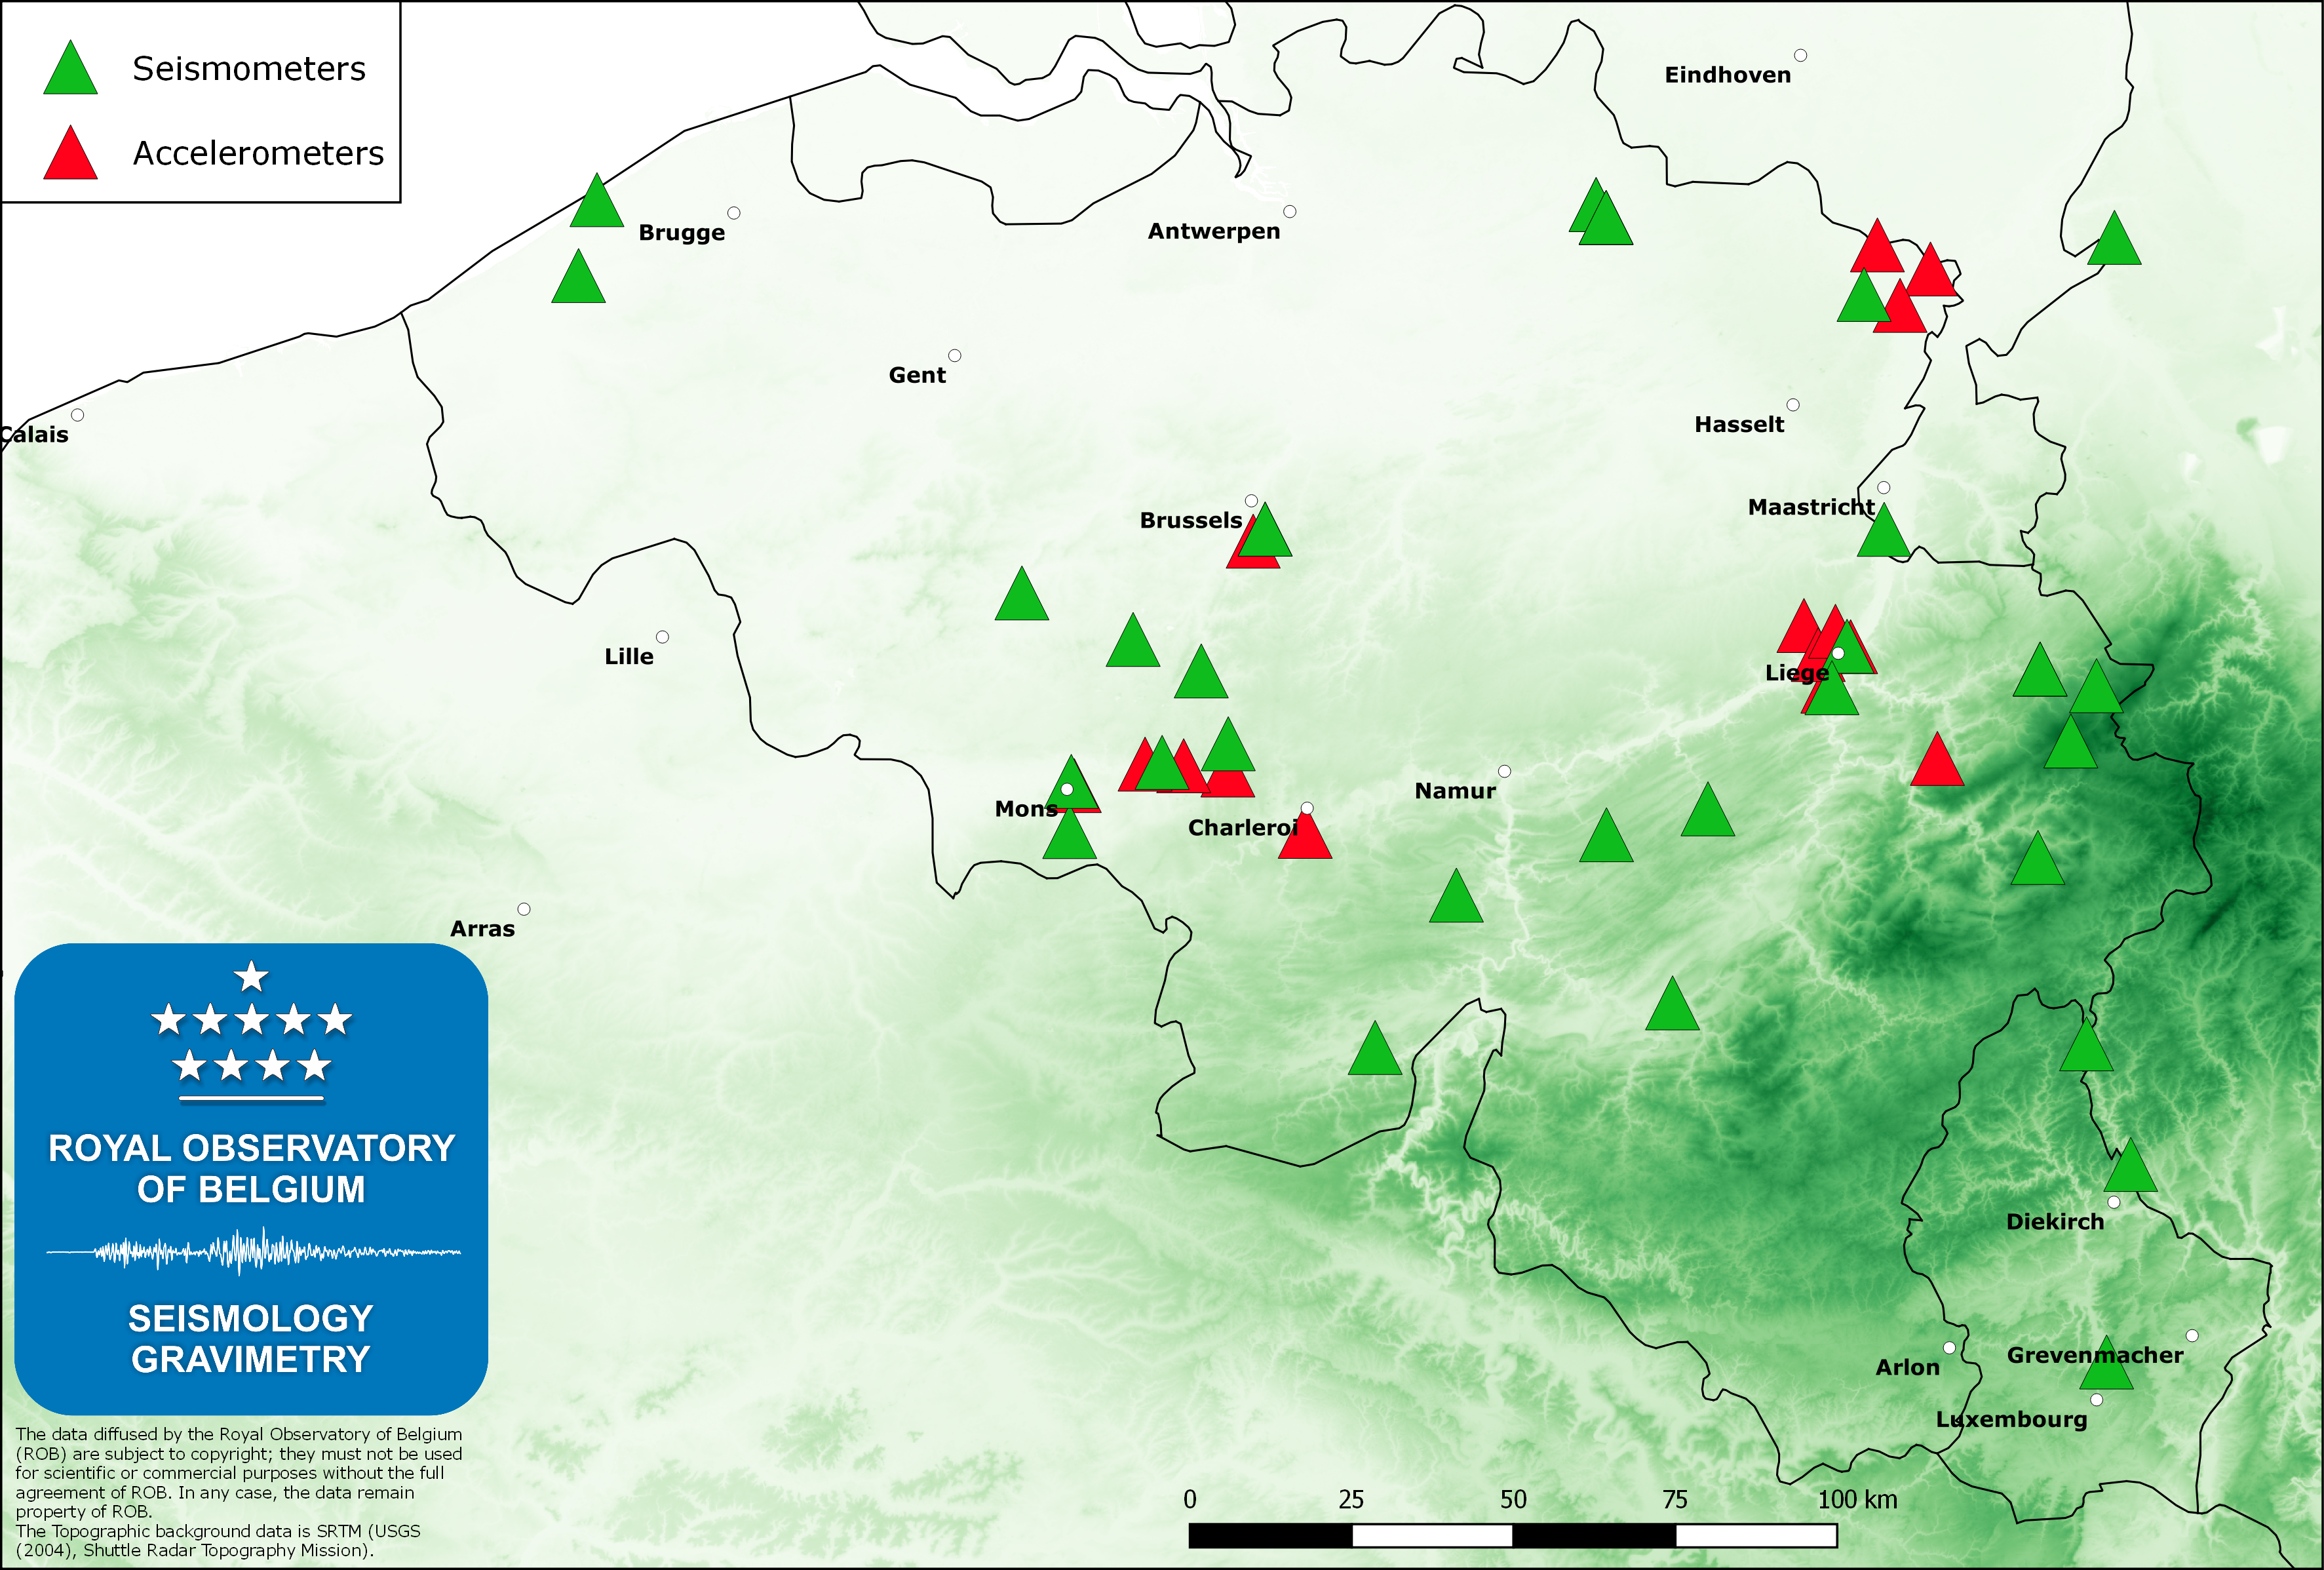
The Belgian seismic network of the Royal Observatory of Belgium (ROB), with about 45 permanent stations, is mainly dedicated to the monitoring and the scientific study of the seismic activity in Belgium. The ROB is also managing 3 stations in the Grand-Duchy of Luxemburg (in cooperation with the European Center for Geodynamics and Seismology). Earthquakes worldwide with magnitude greater than 4.5 – 5.0 are routinely recorded by the Belgian seismic network. The measurements on these recordings are sent to international seismological centers (EMSC and ISC) where data from stations worldwide are analyzed to furnish a global catalogue of earthquakes and phase arrival time models. We also provide real-time seismic signals from some Belgian stations to data exchange centers like ORFEUS (Observatories and Research Facilities for European Seismology) and IRIS (Incorporated Research Institutions for Seismology).To complement the seismic network, the Belgian accelerometric network was installed early in the 2000ies to furnish reliable data when strong ground motions saturate traditional seismometers. This network consists of 19 stations, is sensitive to accelerations of 1E-5 g (g is gravity at the Earth’s surface) and is an important tool for professionals in the field of earthquake engineering and engineering seismology (seismic hazard assessment). Currently, since 2014 the service is installing another network (“AcceleROB“) of 90 low-cost accelerometers. These sensors are calibrated to be sensitive to accelerations of 1E-3 g, which should be observed during any earthquake of local magnitude ML=3 or larger.
-

The Copernicus Urban Atlas (UA) provides European, comparable and detailed land use and land cover maps for the main Functional Urban Areas (FUAs). The Urban Atlas Street Tree Layer (UA-STL) is a separate layer of the Urban Atlas 2012. It includes contiguous rows or patches of trees covering 500 m² or more with a minimum width of 10 m within the urban mask of the Urban Atlas 2012. Gaps between tree patches or within a larger patch that are less than 10m wide are included in the Street Tree Layer. There is no thematic content other than the presence or absence of trees. The UA-STL is a new product and no accuracy threshold was provided as part of the Urban Atlas specifications. The UA STL product validated currently covers just over 7% of the total UA2012 area.
-
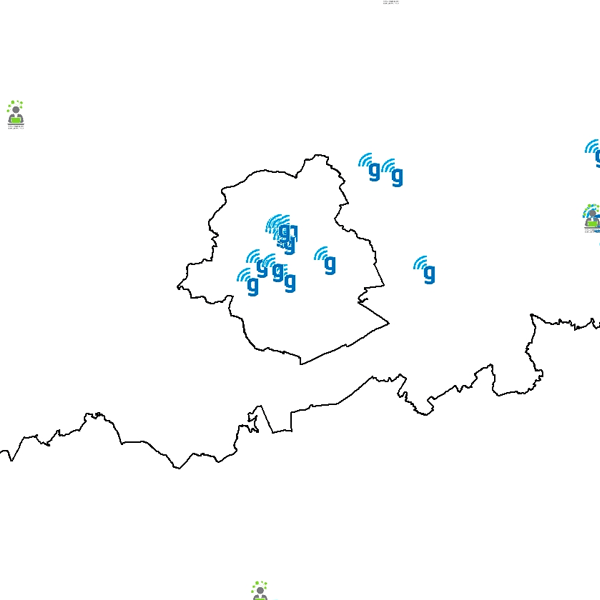
Govroam is a " wifi roaming " solution. This service offers to the users a simple and secure access to the wireless network of their institution, but also to networks of other participating institutions. A user from an organization that participates in govroam will be able to connect to any wireless access point broadcasting govroam. The data provided here makes it possible to locate these access points.
-
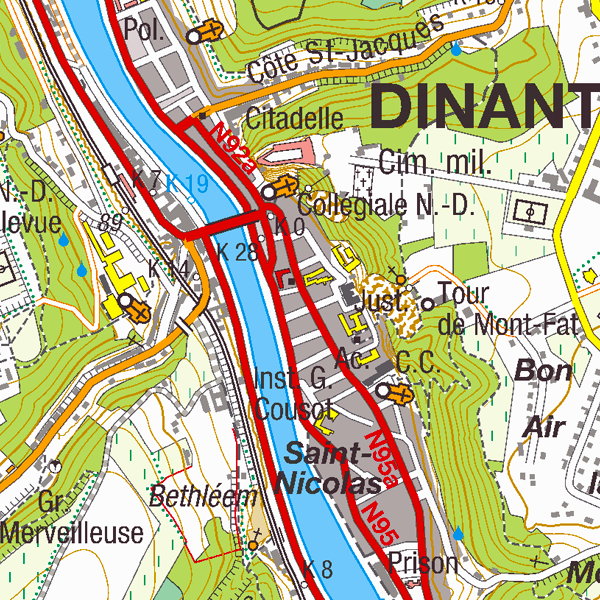
Top25Map is a digital version of the NGI’s topographic cartography on a scale of 1:25 000. These images result from the symbolisation of the objects and themes which are present in the topo-geographic inventory of the Belgian territory (ITGI), which is built and kept up-to-date by the NGI. Top25Map contains all usual themes of the NGI’s cartographic products (land use, transport, hydrography, buildings and constructions, relief,…), as well as the map lettering and the toponyms. The Top25Map cartography is appropriate to hiking.
-
The files contain the population characteristics (total, gender and/or age groups) by statistical sector in Belgium on January 1st, according to the Belgian definition of the population. The Belgian definition does not take into account the 12-months criterion and excludes asylum seekers. More information at https://ec.europa.eu/eurostat/cache/metadata/en/demo_pop_esms.htm#unit_measure1589188532500.
-
The Belgian gravimetric database consists of 69,000 measurements, made using relative spring gravimeters. This database is managed by the Royal Observatory of Belgium since 1925. Two superconducting gravimeters measure elusive gravity variations at the stations of Membach and Rochefort, with a precision better than 1E-10 of gravity at the surface of the Earth (g). Since 1996, an absolute gravimeter performs repeated gravity measurements at selected sites, with an accuracy of 1E-9 g.
-
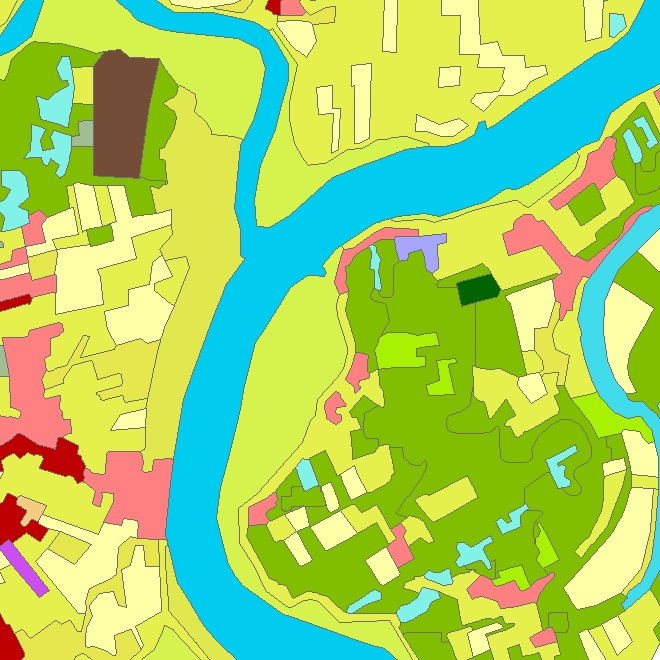
Riparian zones represent transitional areas occurring between land and freshwater ecosystems, characterised by distinctive hydrology, soil and biotic conditions and strongly influenced by the stream water. They provide a wide range of riparian functions (e.g. chemical filtration, flood control, bank stabilization, aquatic life and riparian wildlife support, etc.) and ecosystem services. The Riparian Zones products will support the objectives of several European legal acts and policy initiatives, such as the EU Biodiversity Strategy to 2020, the Habitats and Birds Directives and the Water Framework Directive. Two complementary product groups provide detailed information on the state and characteristics of riparian zones across Belgium: 1. Land Cover / Land Use (LCLU) 2. Green Linear Elements (GLE)
-
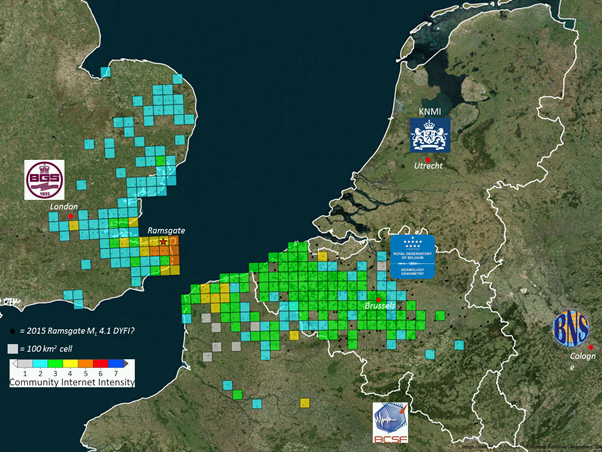
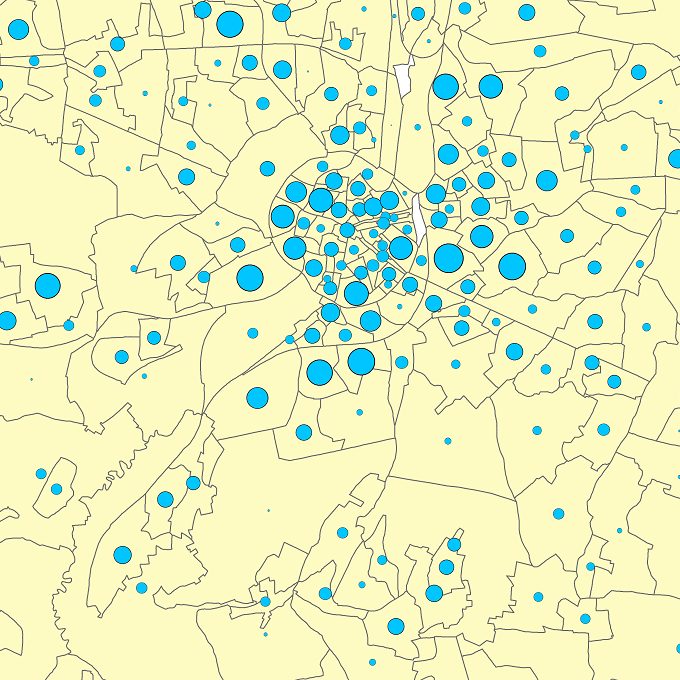
The earthquake catalogue and database of the Royal Observatory of Belgium contains source parameters of earthquakes that occurred in and around Belgium since 1350. Similar to most other seismic catalogues in the world, the ROB catalogue is heterogeneous, as it is based on the analysis of two different types of data: - Historical data: concern the period from about 1350 to 1910, for which only local reports about damage and felt effects (i.e. intensity) of earthquakes are available (“macroseismic” observations); - Instrumental data: concern the period from 1911 onward, the year continuous seismic recordings in Belgium started, up to the present day. For earthquakes during this period both intensity data (from macroseismic enquiries with the local authorities and, since 2000, on the internet) and seismic recordings are available. The earthquake catalogue is a list of earthquakes with the following parameters: origin time (year, month, day, hour, minute, second), geographic coordinates of the hypocenter (latitude, longitude, focal depth), magnitude (local magnitude ML, surface-wave magnitude Ms and/or moment magnitude Mw), maximum observed intensity, and the name of the locality. The ROB catalogue is considered to be complete: - Since 1350 for earthquakes with Mw>=5.0; - Since 1905 for earthquakes with Mw>=4.0 (seismic station in Uccle and neighboring countries); - Since 1960 for earthquakes with Mw>=3.0 (4 stations in Belgium); - Since 1985 for earthquakes with Mw>=2.0 (modern digital network consisting of 20+ stations).
-
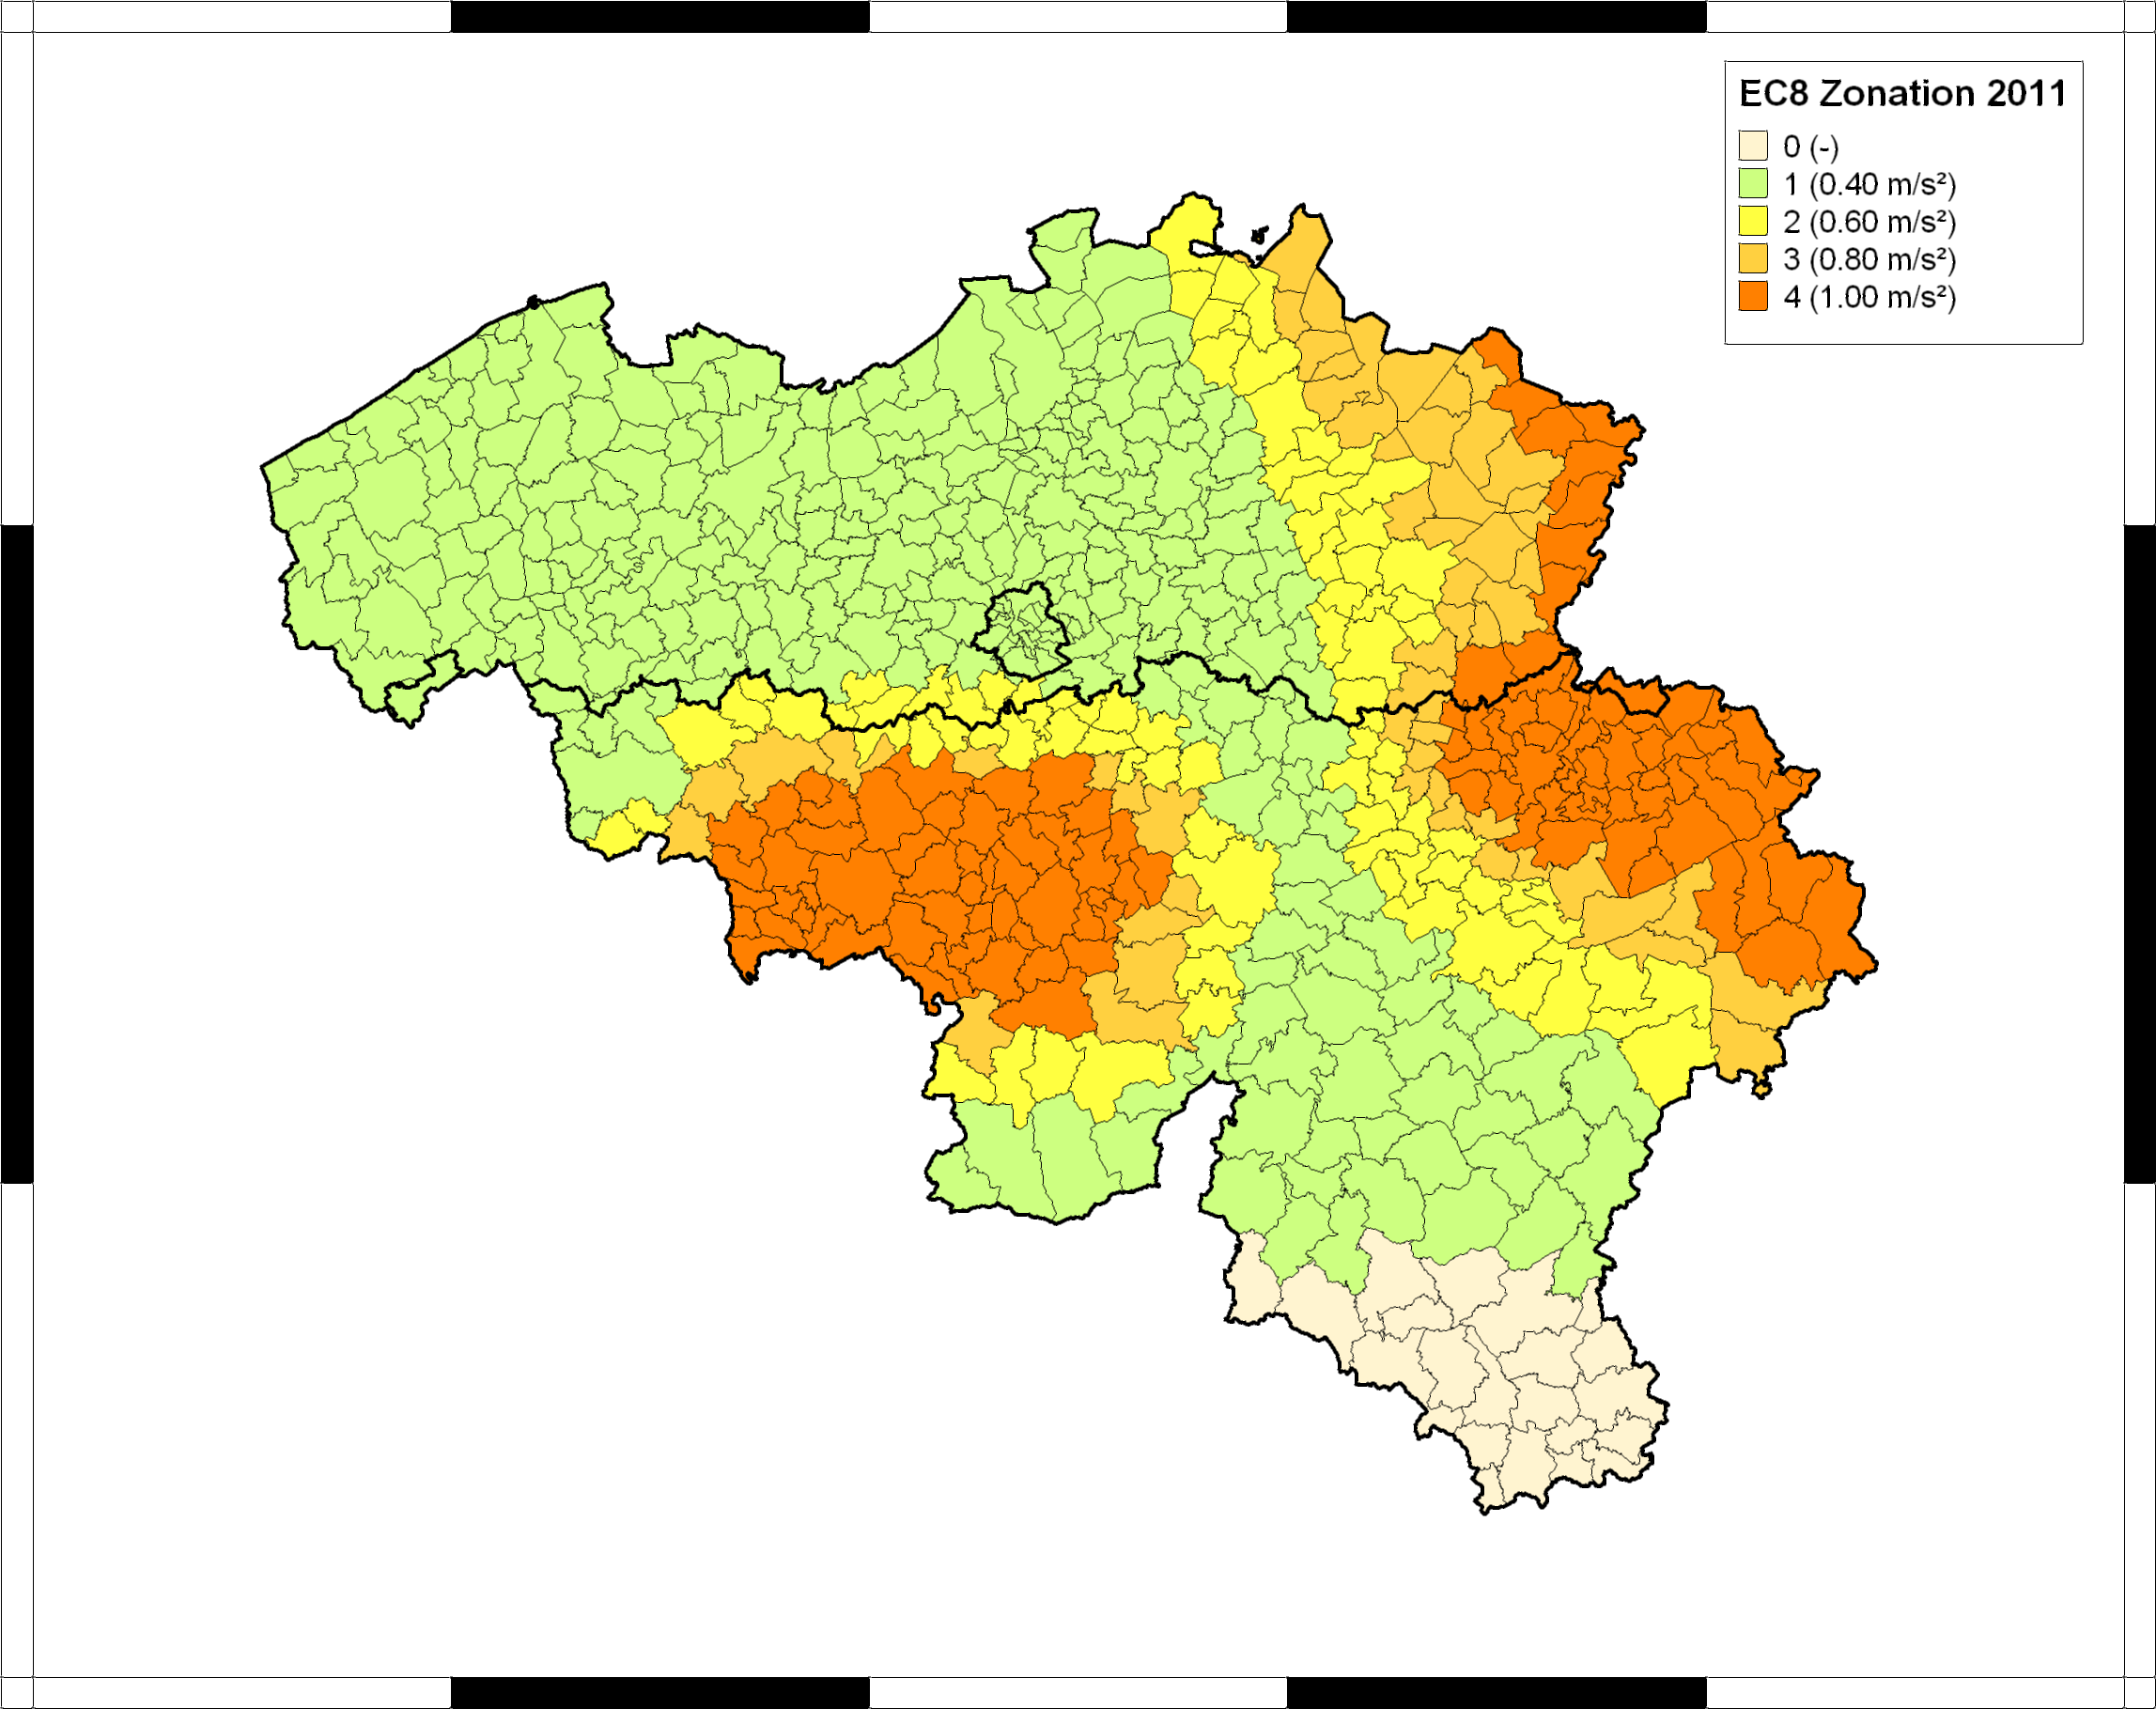
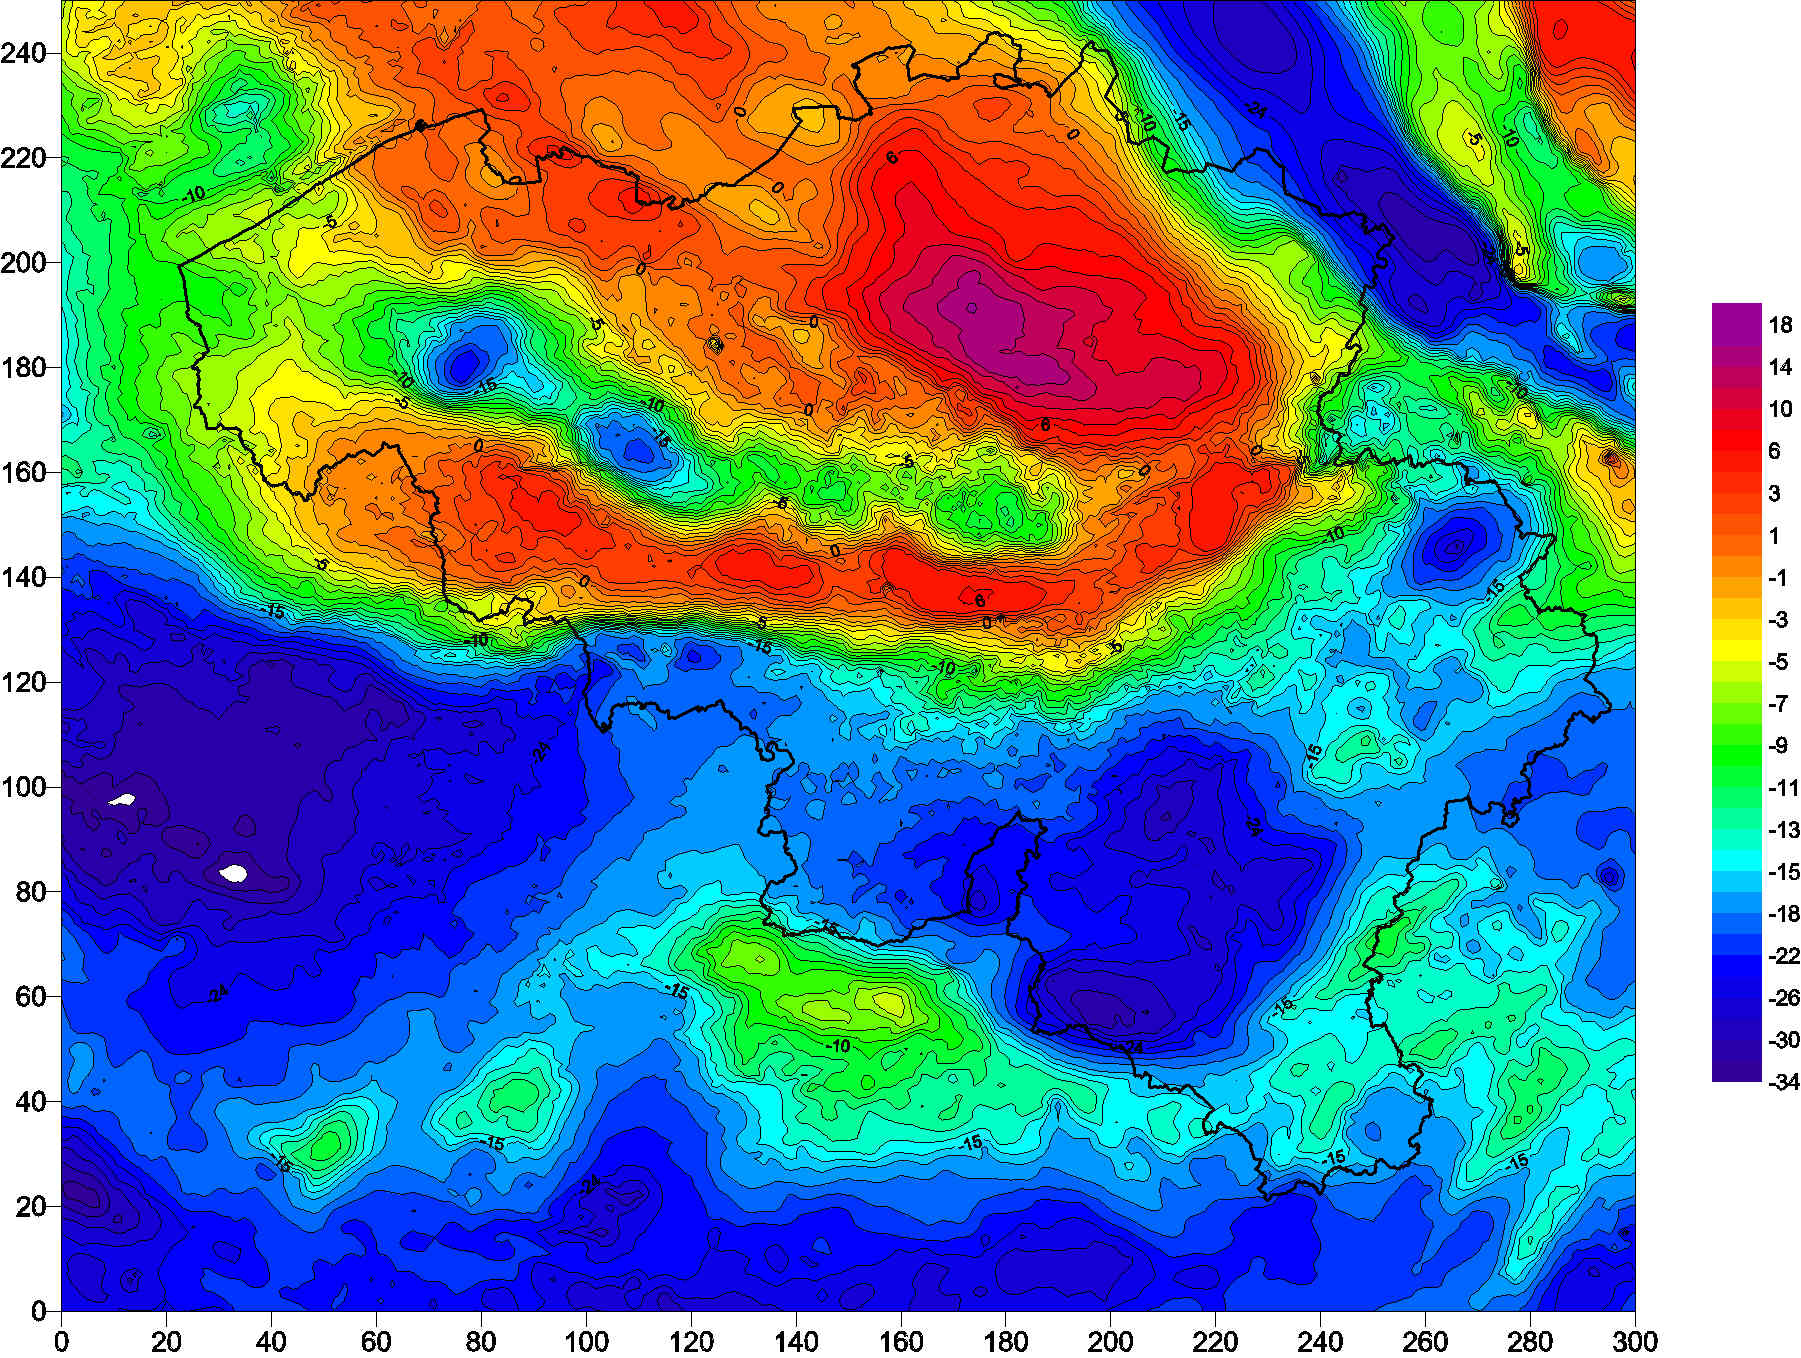
The seismic zoning map for Belgium was published in the Belgian national annex (NBN EN 1998-1 ANB) to the European building code Eurocode 8 (EN 1998-1), which became effective in all European member states in 2011. This map classifies Belgian communes into five seismic zones, corresponding to different values of the reference peak ground acceleration (PGA) to be taken into account in the design of structures for earthquake resistance. In combination with the importance class of the building and the ground type, the reference PGA is used to calculate the design response spectrum defining the accelerations that the structure should be able to withstand without collapse. For further details and the precise specifications, users should consult the normative documents, which can be ordered from the Bureau for Standardisation NBN (https://www.nbn.be/en). The Eurocode-8 seismic zoning map for Belgium was established by the Royal Observatory of Belgium, based on a reimplementation of the seismic hazard map of Leynaud et al. (2000) for a return period of 475 years (equivalent to 10% probability of exceedance in a timespan of 50 years). This hazard map was calculated following the principles of probabilistic seismic hazard assessment, and based on a simple model of seismic sources and their activity in and around Belgium, and a single ground-motion model (or “attenuation law”), describing PGA in function of earthquake magnitude and epicentral distance. To date, this is the only seismic hazard map that has been published specifically for Belgium, and it is still considered as the official seismic hazard map for Belgium.