 geo.be Metadata Catalog
Royal Belgian Institute of Natural Sciences (RBINS), Directorate Natural Environment (OD Nature), Belgian Marine Data Centre (BMDC)
Type of resources
Topics
INSPIRE themes
Keywords
Contact for the resource
Provided by
Years
Formats
Representation types
Scale
-
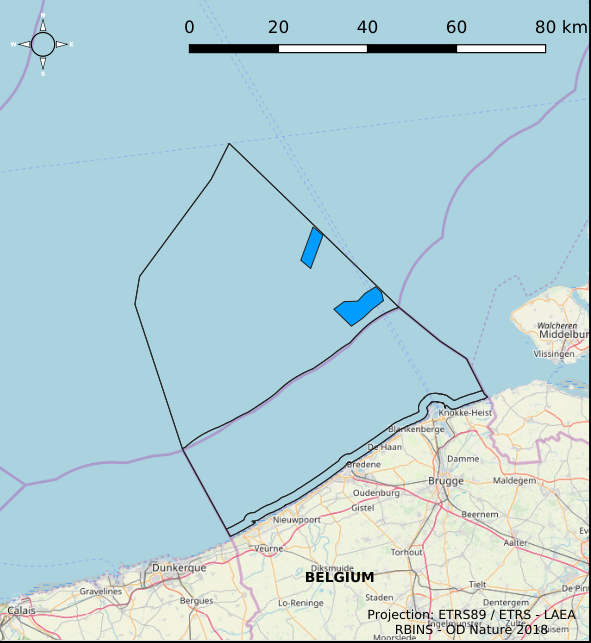
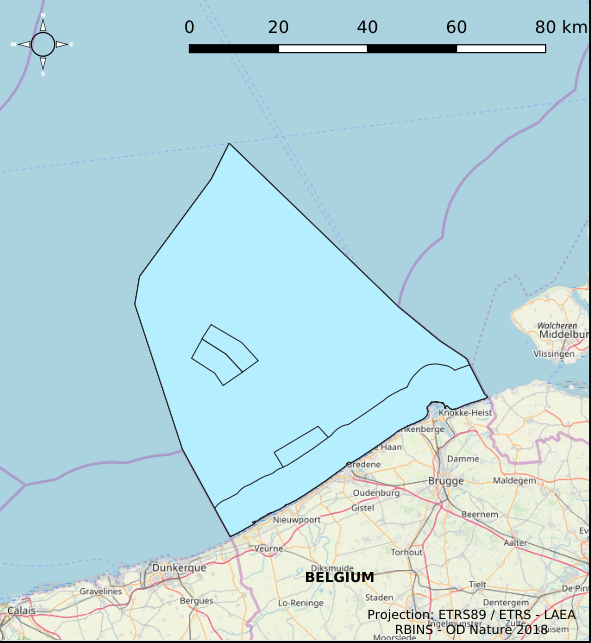
This dataset represents the location of the Princess Elizabeth zone in the Belgian Part of the North Sea as described in the Royal Decree of May 22th, 2019, establishing a marine spatial plan for the period 2020-2026. Art. 8. § 3.
-

This dataset is part of the 2018 Belgian submission for the Marine Strategy Framework Directive (MSFD) linked to descriptor 11, criterion 1. This dataset describes the impulsive noise generated during percussion pile emplacement for offshore wind farm construction and unexploded ordnance (UxO) explosions. Impulsive underwater sound (pressure) was measured during pile driving operations in Belgian waters, for different types of foundations (monopiles of different diameters, foundations of ducts with a smaller diameter) and hydraulic hammers with different energy powers. The results of measurements at Bligh Bank and Thornton Bank, with a resulting extrapolation of zero to peak noise level (Lz-p) at 750m and Sound Exposure Level (SEL) (no mitigation measures deployed), are presented (Norro et al., 2013).
-
The Royal Decree of 22 May 2019 establishing a marine spatial plan defines 4 aquaculture zones: Zone 1 for aquaculture (Eastern zone) (Art. 14§1), Zone 2 for aquaculture (Noordhinder Noord) (Art. 14§2), Zone 3 for aquaculture (Noordhinder Zuid) (Art. 14§3), Zone 4 for aquaculture (Fairybank) (Art. 14§3). It replaces the 2014 Marine Spatial Plan, which is included for completeness. The Royal Decree of 20 March 2014 establishing a marine spatial plan defines in its Art. 10, two zones for sustainable aquaculture: Zone 1 for sustainable aquaculture, Art. 10 § 2 Zone 1; Zone 2 for sustainable aquaculture, Art. 10 § 2 Zone 2. These zones are made available digitally in the resource described by this metadata document. Please refer to the Belgian official gazette (\"Moniteur belge/Belgisch Staatsblad\") for official reference information.
-
This dataset is part of the Belgian submission for the 2018 Marine Strategic Framework Directive (MSFD) and reports on descriptor 1, criterion 6. This dataset describes the soft benthos analysis performed in the Belgian part of the North Sea between 2010 and 2016. Information on the location, date and procedure used for the sediment sampling is povided as well as the description of the species found in the samples. Based on this dataset, the Belgian MSFD reporting concluded that the benthic habitat quality is clearly lower in areas where a certain activity interferes with the environment in an intensive way.
-
This datasets is a summary of the CTD profiles measured with the RV Belgica. It provides general meta-information such as the campaign code, the date of measurement and the geographical information. An important information is the profile quality flag that describes the validity of the data. A quality flag = 2 means the data is generally good although some outliers can still be present. A quality flag = 4 means the data should not be trusted. 1 meter binned data can be download on the SeaDataNet CDI portal (enter the cruise_id in the search bar) ONLY for the good quality profiles. Full acquisition frequency datasets are available on request to BMDC.
-
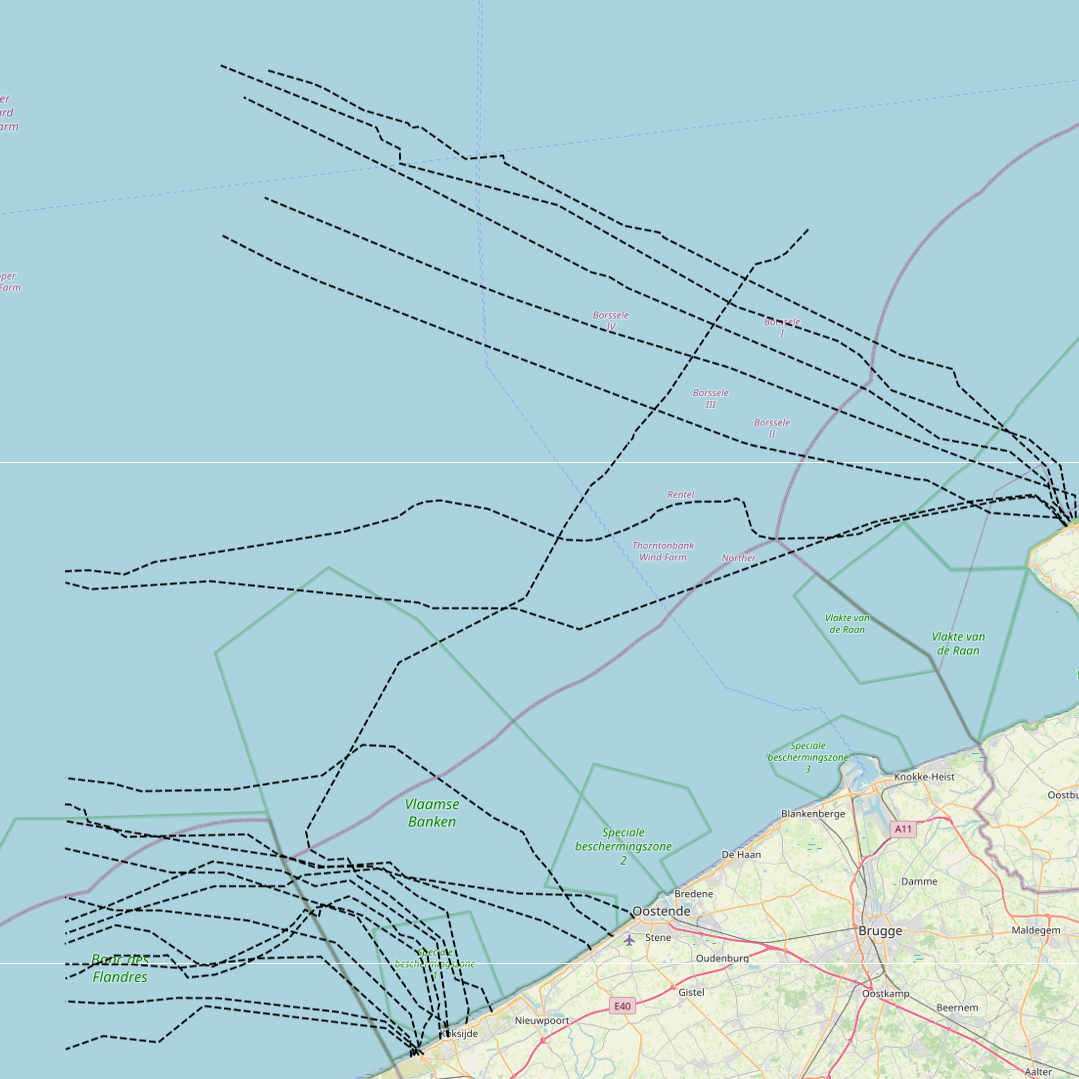
This dataset represents the exact location of disused telecommunication cables installed in the Belgian Part of the North Sea.
-
The Geological Map of Belgium at a scale of 1:40000 is published by the Belgian Geological Survey.
-
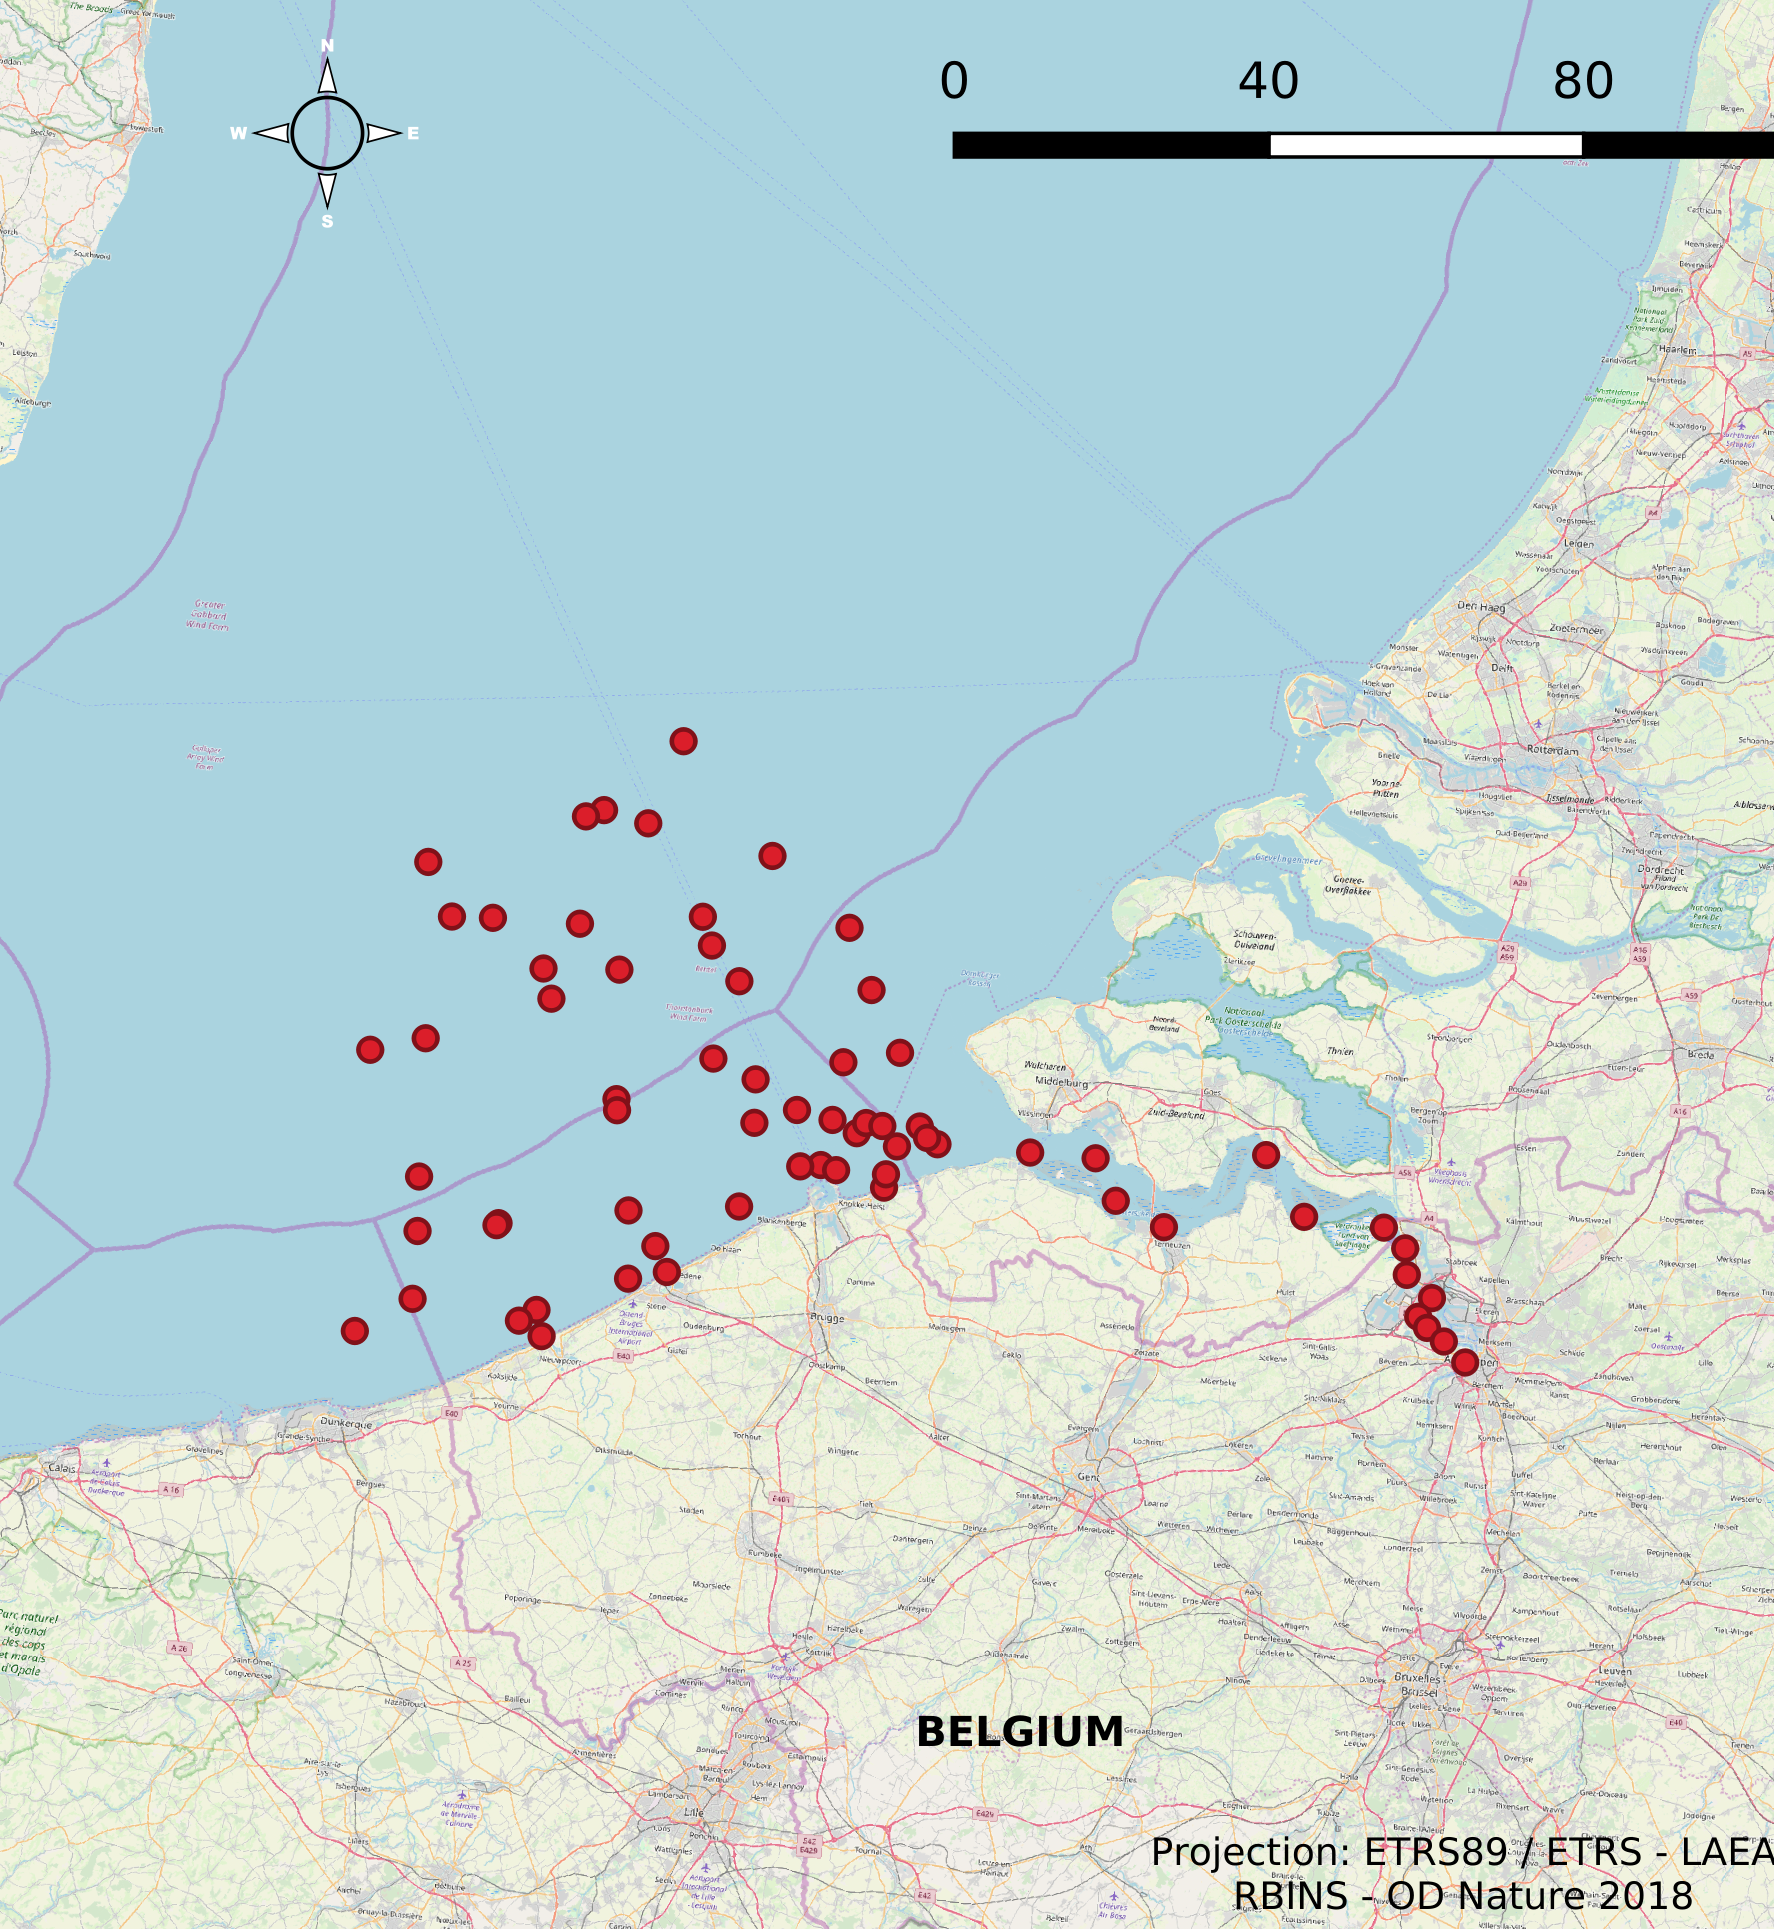
The Scientific Service Management Unit of the Mathematical Model of the North Sea of the Royal Belgian Institute for Natural Sciences has been operating monitoring stations on the Belgian Part of the North Sea since the 1970s. These stations are located in the Scheldt estuary, at open sea and in coastal waters. In 2007, 10 new stations were designated and were placed in the monitoring network needed for the OSPAR convention, the Water Framework Directive and the Marine Strategic Framework Directive. These replaced a series of 54 previous monitoring stations whose data was gathered throughout the years for the Belgian Monitoring Programme and reported according to the recommendations of the OSPAR Convention. This dataset contains information on all monitoring stations ever used by the Scientific Service Management Unit of the Mathematical Model of the North Sea. The dataset provides location, name, operational history and for which reporting obligations they are used.
-
The Royal Decree of 22 May 2019 establishing a marine spatial plan defines 7 fishery management zones: Professional fisheries (Art. 13), Passive fisheries area (Noordhinder Noord) (Art. 14§4), Passive fisheries area (Noordhinder Zuid) (Art. 14§4), Passive fisheries (Fairybank) (Art. 14§4), Search area 1 for fisheries techniques (Art. 6§1), Search area 2 for fisheries techniques (Art. 6§1), Search area 3 for fisheries techniques (Art. 6§1). It replaces the 2014 Marine Spatial Plan, which is included for completeness. The Royal Decree of 20 March 2014 establishing a marine spatial plan defines in its Art. 6, six fisheries management areas: Regular regime, Art. 6 § 1; Fisheries management area 1, Art. 6 § 1.1°; Fisheries management area 2, Art. 6 § 1.2°; Fisheries management area 3, Art. 6 § 1.3°; Fisheries management area 4, Art. 6 § 1.4°; Fisheries management area 5, Art. 6 § 3. These zones are made available digitally in the resource described by this metadata document. Please refer to the Belgian official gazette (\"Moniteur belge/Belgisch Staatsblad\") for official reference information.
-
This dataset is part of the 2018 Belgian submission for the Marine Strategy Framework Directive (MSFD) linked to descriptor 6, criterion 1. This dataset describes and maps the the physical loss of the seabed in the Belgian part of the North Sea (BPNS) in the period 2011-2016. The dataset combines the different human activities responsible for a loss of seabed, including wrecks, measuring piles and radar stations, pipelines, power and telecommunication cables with their rock dump, and wind farms. The area lost is mapped and quantified per year, per activity and per benthic broad habitat.