 geo.be Metadata Catalog
Royal Meteorological Institute of Belgium
Type of resources
Available actions
Topics
INSPIRE themes
Keywords
Contact for the resource
Provided by
Years
Formats
Representation types
Update frequencies
status
Service types
Resolution
-
-
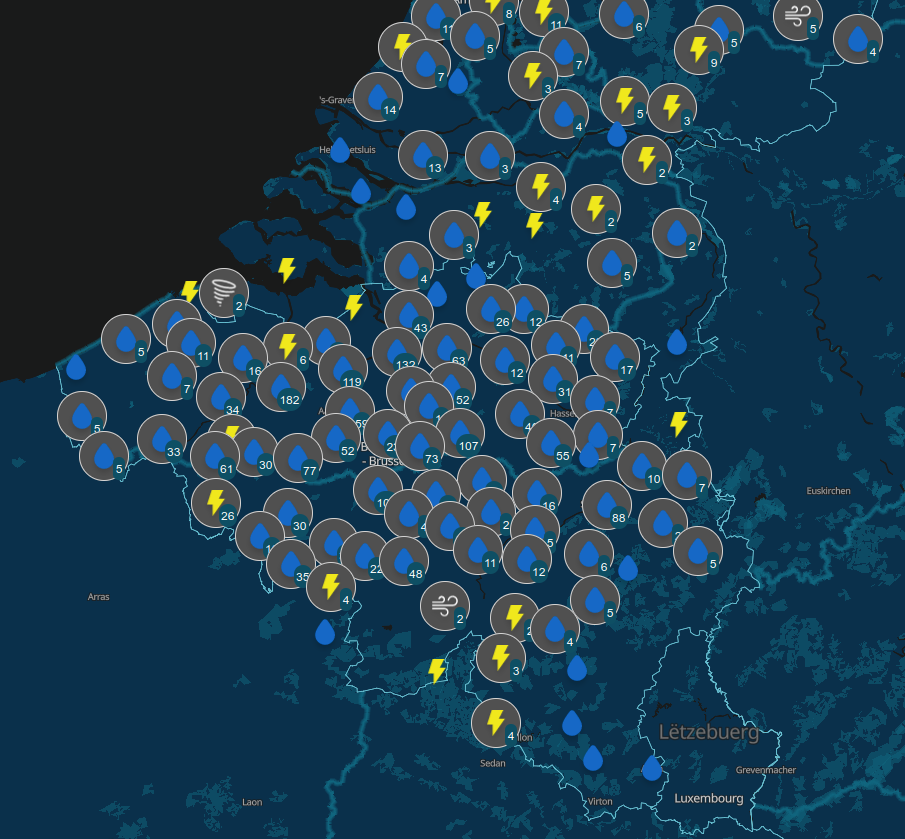
View Service (WMS) for Synoptic observations
-
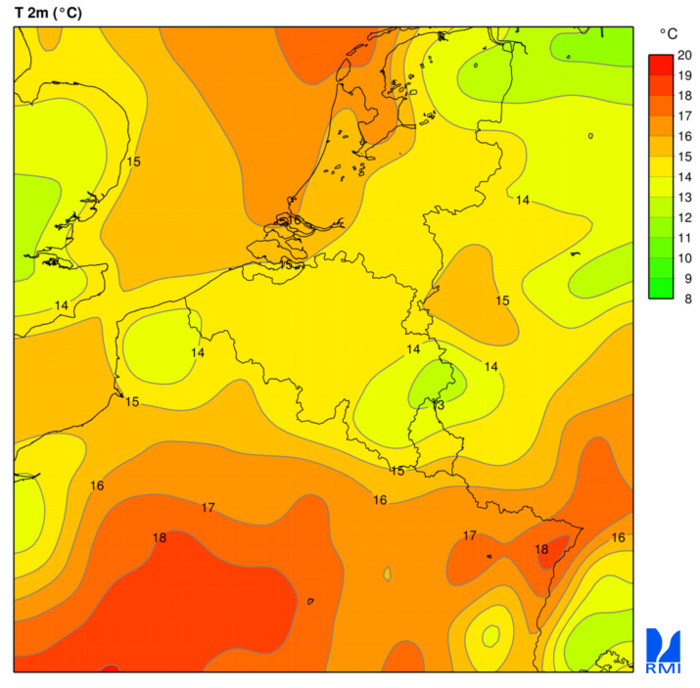
Download Service (WCS) for Alaro over Belgium. All the parameters of the last run of Alaro can be downloaded in grid format
-
View Service (WMS) for Lidar over Belgium The data are updated regularly. Only the archives of the last two months are available.
-
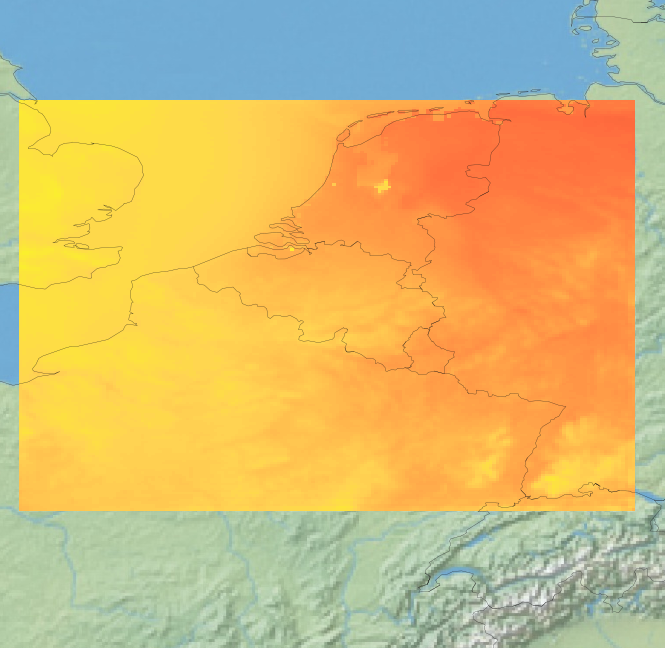
View Service (WMS) for Alaro over Belgium. All the parameters of the last run of Alaro can be visualized, most of them associated with a custom style.
-
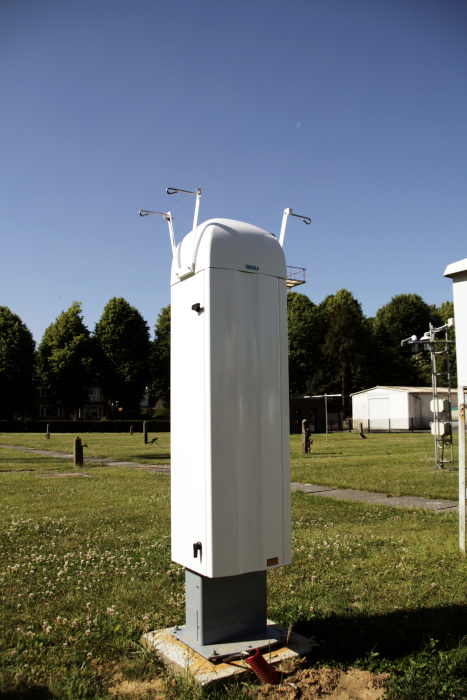
View Service (WMS) for Automatic weather station (AWS) observations
-
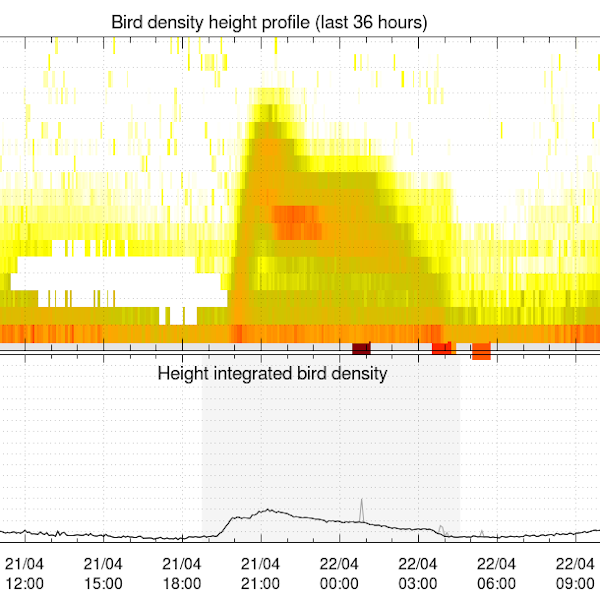
Bird density profiles are derived from weather radar volume data in real time, by the vol2bird algorithm as described in Dokter et al. (2011, 2019). The vol2bird algorithm exploits the radar reflectivity characteristics of different scatterers in the atmosphere, in order to distinguish biological from non-biological radar echoes. Once biological scatterers are isolated in the volume files, the reflectivity of these scatterers is converted in an estimate of the bird density per vertical layer of 200m, using a mean cross section of 11 cm2. The vbird profiles are provided for the following radars, with the radar owner in parentheses: Jabbeke (RMI), Wideumont (RMI), Helchteren (VMM), Zaventem (Skeyes), Herwijnen (KNMI), Den Helder (KNMI), Neuheilenbach (DWD), Essen (DWD), Abbeville (Météo-France) and Avesnois (Météo-France). References: - Dokter A.M., Liechti F., Stark H., Delobbe L., Tabary P., Holleman I., Bird migration flight altitudes studied by a network of operational weather radars, J. R. Soc. Interface, 8, 30–43, 2011, DOI 10.1098/rsif.2010.0116 - Dokter A.M., Desmet P., Spaaks J.H., van Hoey S., Veen L., Verlinden L., Nilsson C., Haase G., Leijnse H., Farnsworth A., Bouten W., Shamoun-Baranes J., bioRad: biological analysis and visualization of weather radar data, Ecography, 42, 852-860, 2019, DOI 10.1111/ecog.04028
-

From multiple observations during the day with UV spectrophotometers a daily value of the ozone column is calculated. This product is not publically available yet.
-
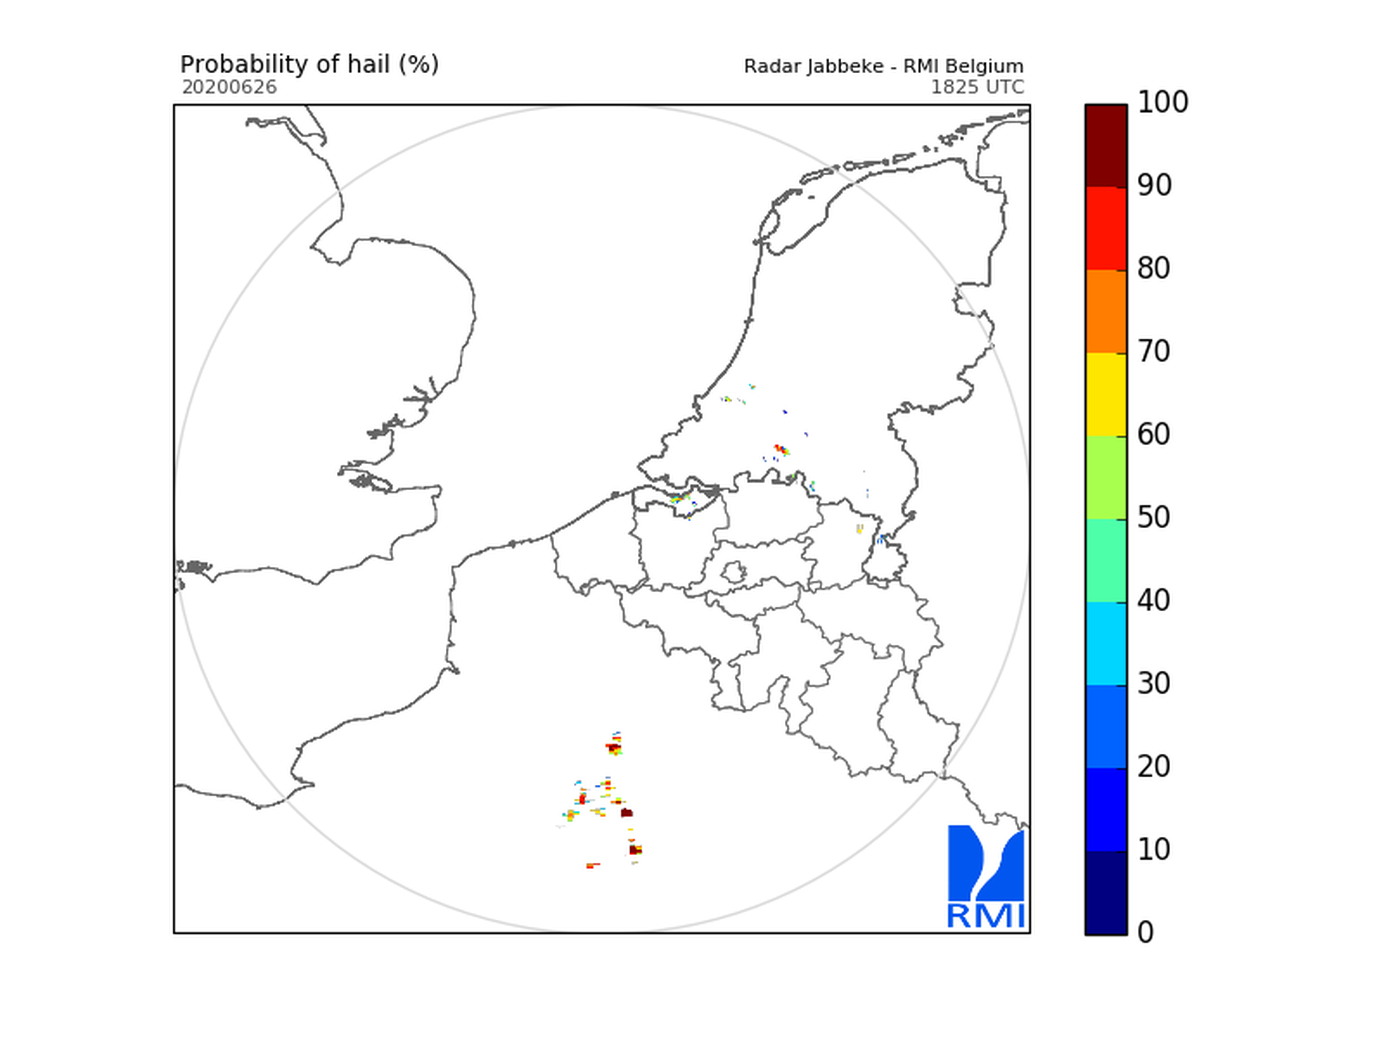
Hail products are derived from the observed vertical profiles of radar reflectivity and the NWP vertical profiles of temperature. Three types of products are generated. poh : probability of hail of any size (larger than 0.5 cm diameter)expressed in %. posh : probability of severe hail(larger than 2cm)expressed in %. mesh : maximum expected size of hailexpressed in mm of hailstone diameter. All products are generated every 5 minutes. This product is not publically available yet.
-
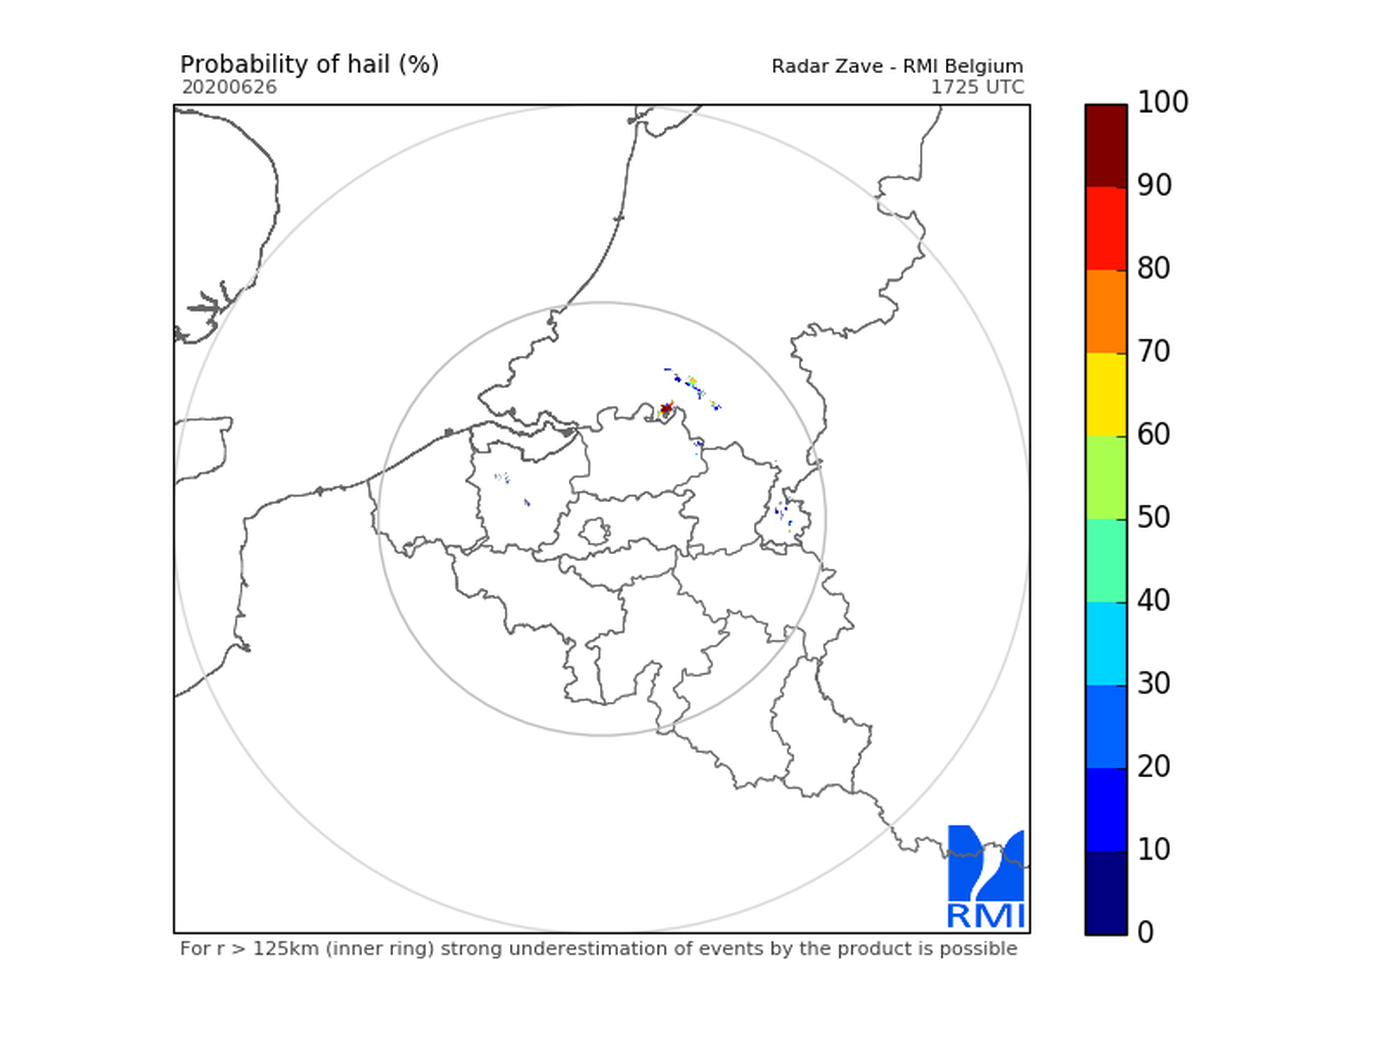
Hail products are derived from the observed vertical profiles of radar reflectivity and the NWP vertical profiles of temperature. Three types of products are generated. poh : probability of hail of any size (larger than 0.5 cm diameter)expressed in %. posh : probability of severe hail(larger than 2cm)expressed in %. mesh : maximum expected size of hailexpressed in mm of hailstone diameter. All products are generated every 5 minutes. This product is not publically available yet.