 geo.be Metadata Catalog
Royal Meteorological Institute of Belgium
Type of resources
Available actions
Topics
INSPIRE themes
Keywords
Contact for the resource
Provided by
Years
Formats
Representation types
Update frequencies
status
Service types
Resolution
-
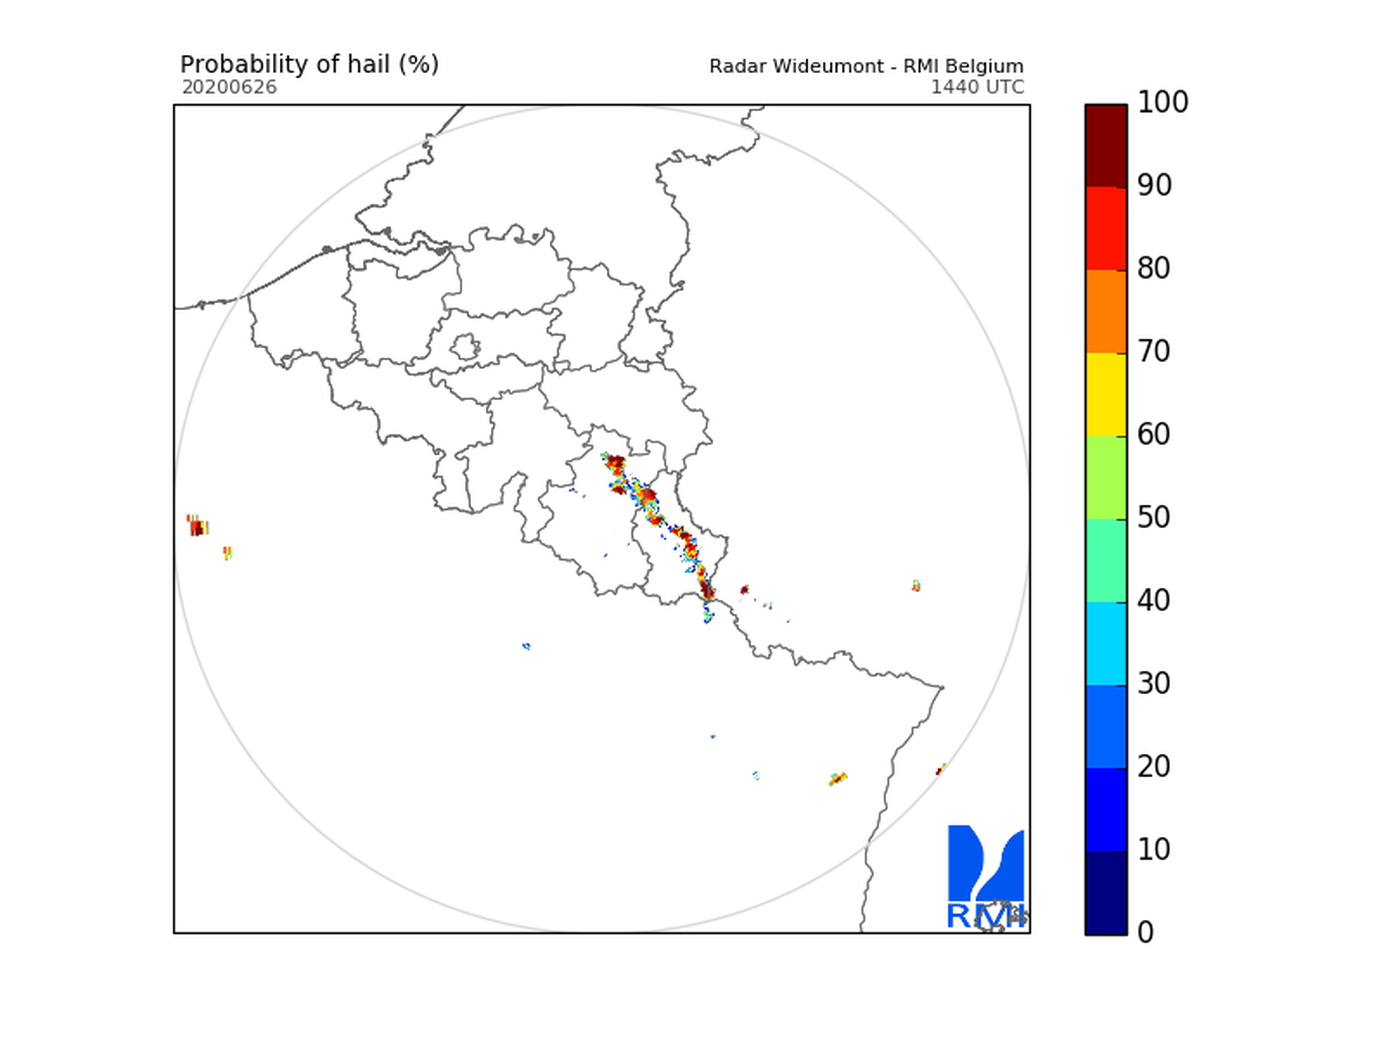
Hail products are derived from the observed vertical profiles of radar reflectivity and the NWP vertical profiles of temperature. Three types of products are generated. poh : probability of hail of any size (larger than 0.5 cm diameter)expressed in %. posh : probability of severe hail(larger than 2cm)expressed in %. mesh : maximum expected size of hailexpressed in mm of hailstone diameter. All products are generated every 5 minutes. This product is not publically available yet.
-
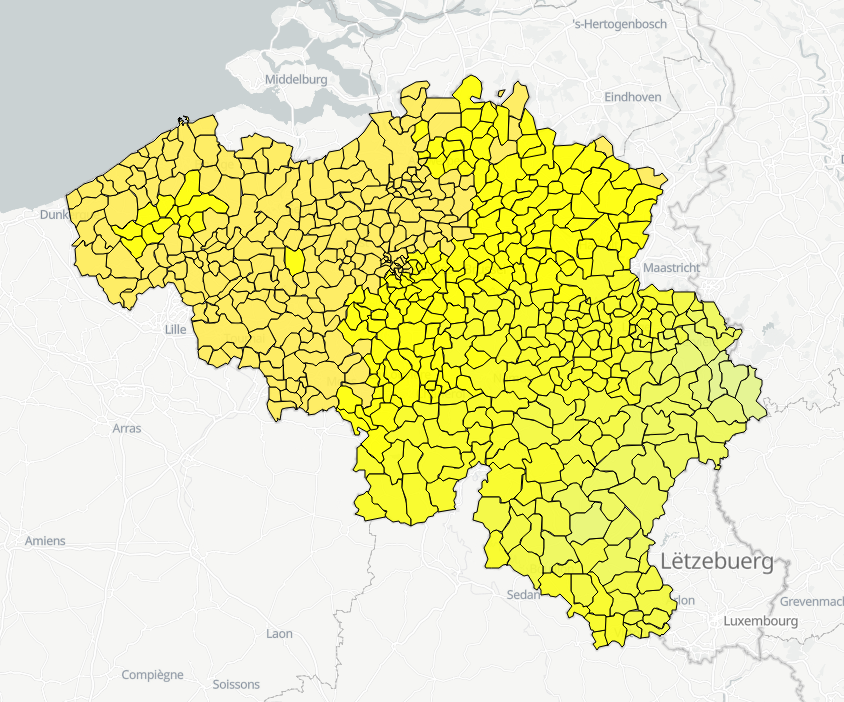
Hourly forecasts for each belgian commune, from current hour up to the next 5 days. This product is not publically available.
-
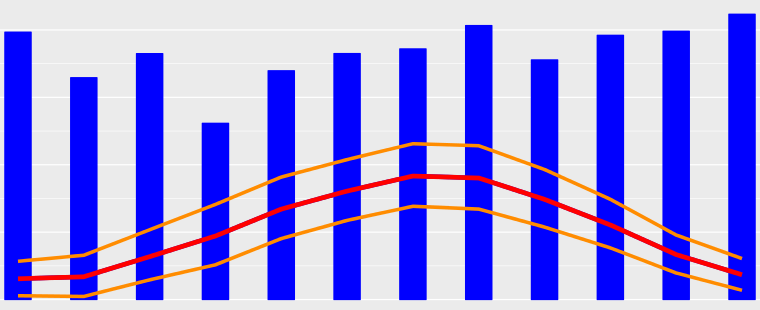
A climate normal is an average over a 30-years period. The period 1981-2010 is the current reference period recommended by the World Meteorological Organization (WMO). Recent climate normals are available for any locations in Belgium and several parameters including air temperature, precipitations and solar radiation. Climate normals for the reference period 1981-2010 are available for air temperature, precipitation and derived parameters (e.g., annual number of summer days, annual number of precipitation days, etc.). For solar radiation, the reference period had to be adjusted to 1984-2013 because of data availability. These climate normals are available as maps and as table for each Belgian municipality.
-
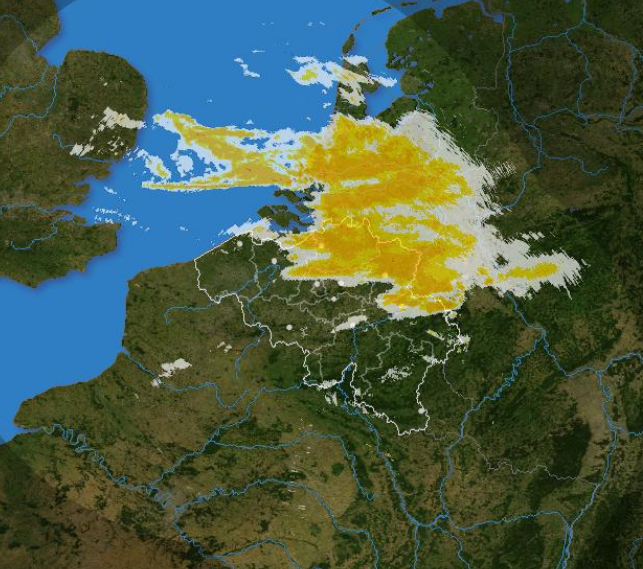
The composite is produced every 5 minutes using the reflectivity data from the Wideumont and Jabbeke weather radars. This product is not publicly available yet.
-
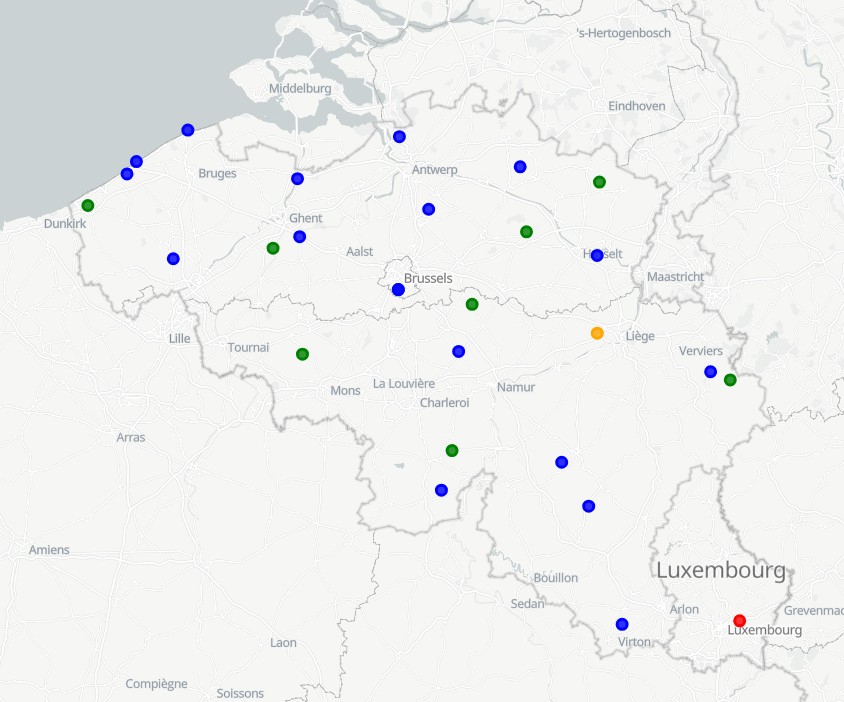
View Service (WMS) for Automatic weather station (AWS) observations
-
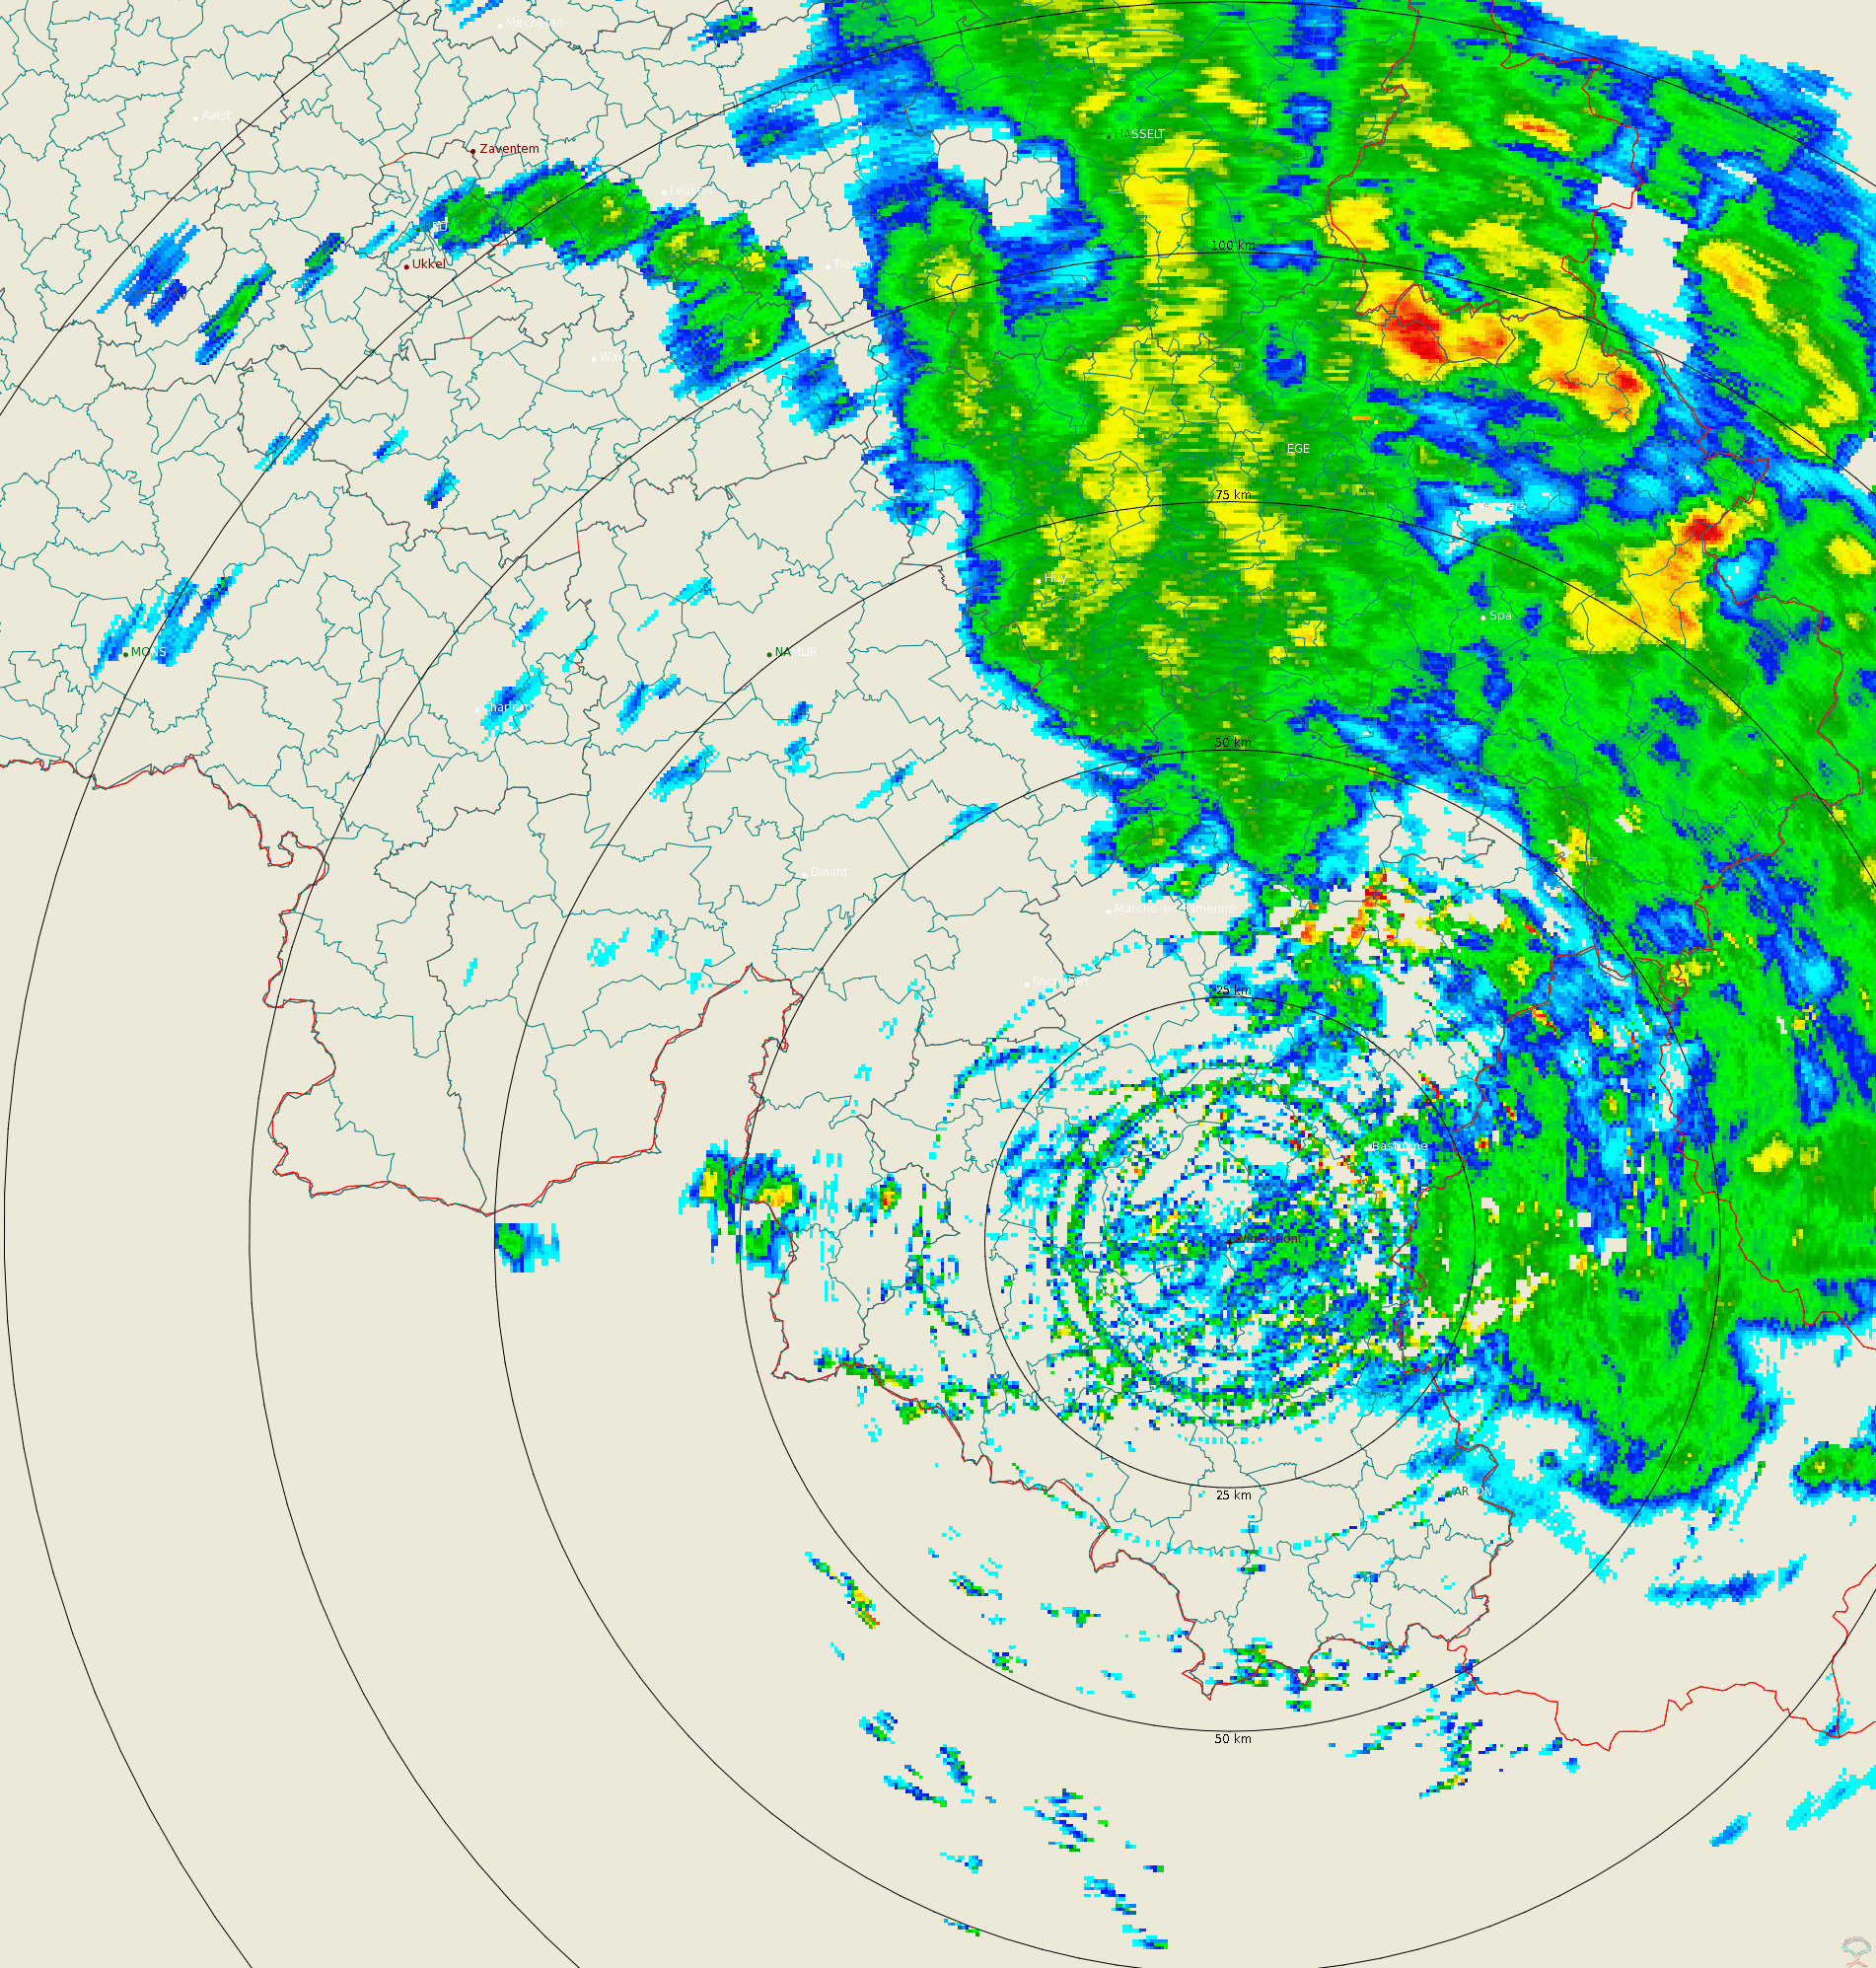
Polar volume reflectivity data from the Wideumont weather radar. Volume data files are produced every 5 minutes from a multiple elevation scan. This product is not publicly available yet.
-
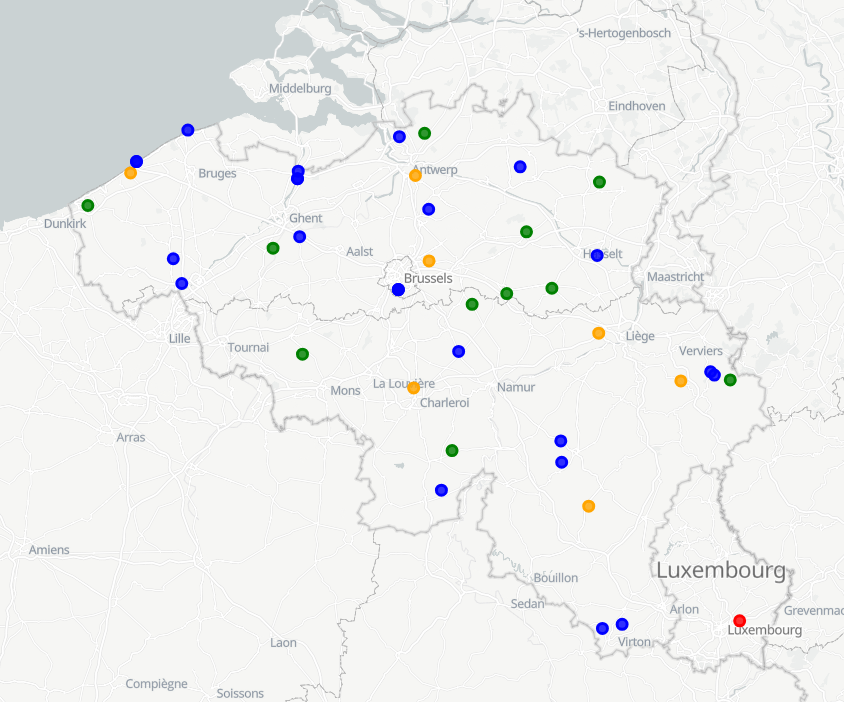
View Service (WMS) for Synoptic observations
-
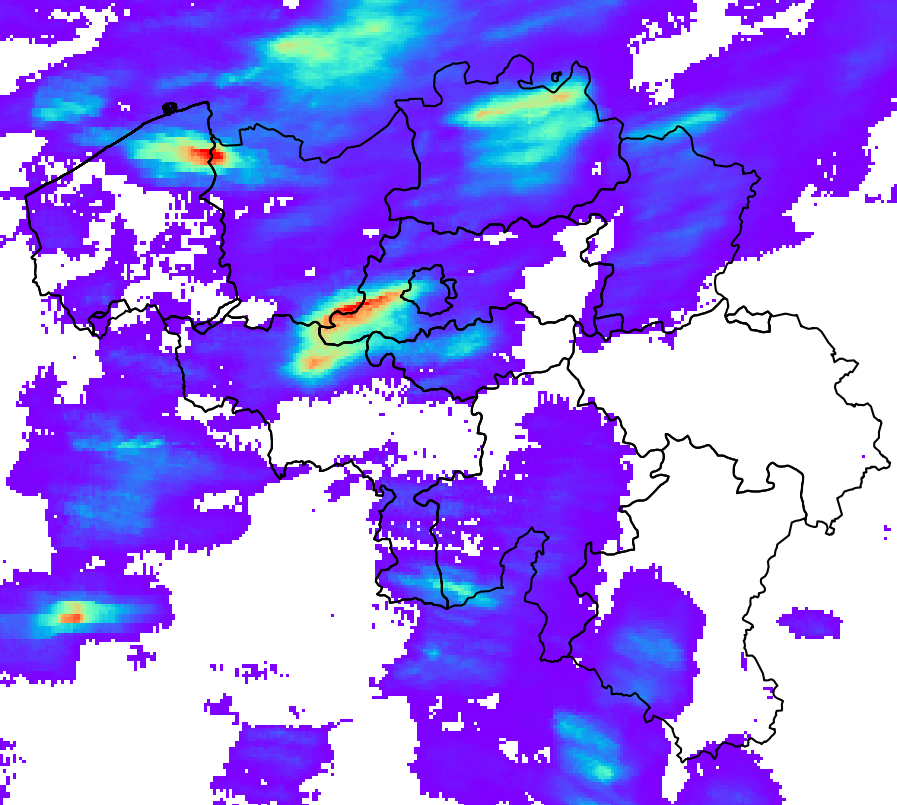
RADQPE provides high resolution radar-based quantitative precipitation estimation in realtime for Belgium and its surroundings. This product is not publically available yet.
-
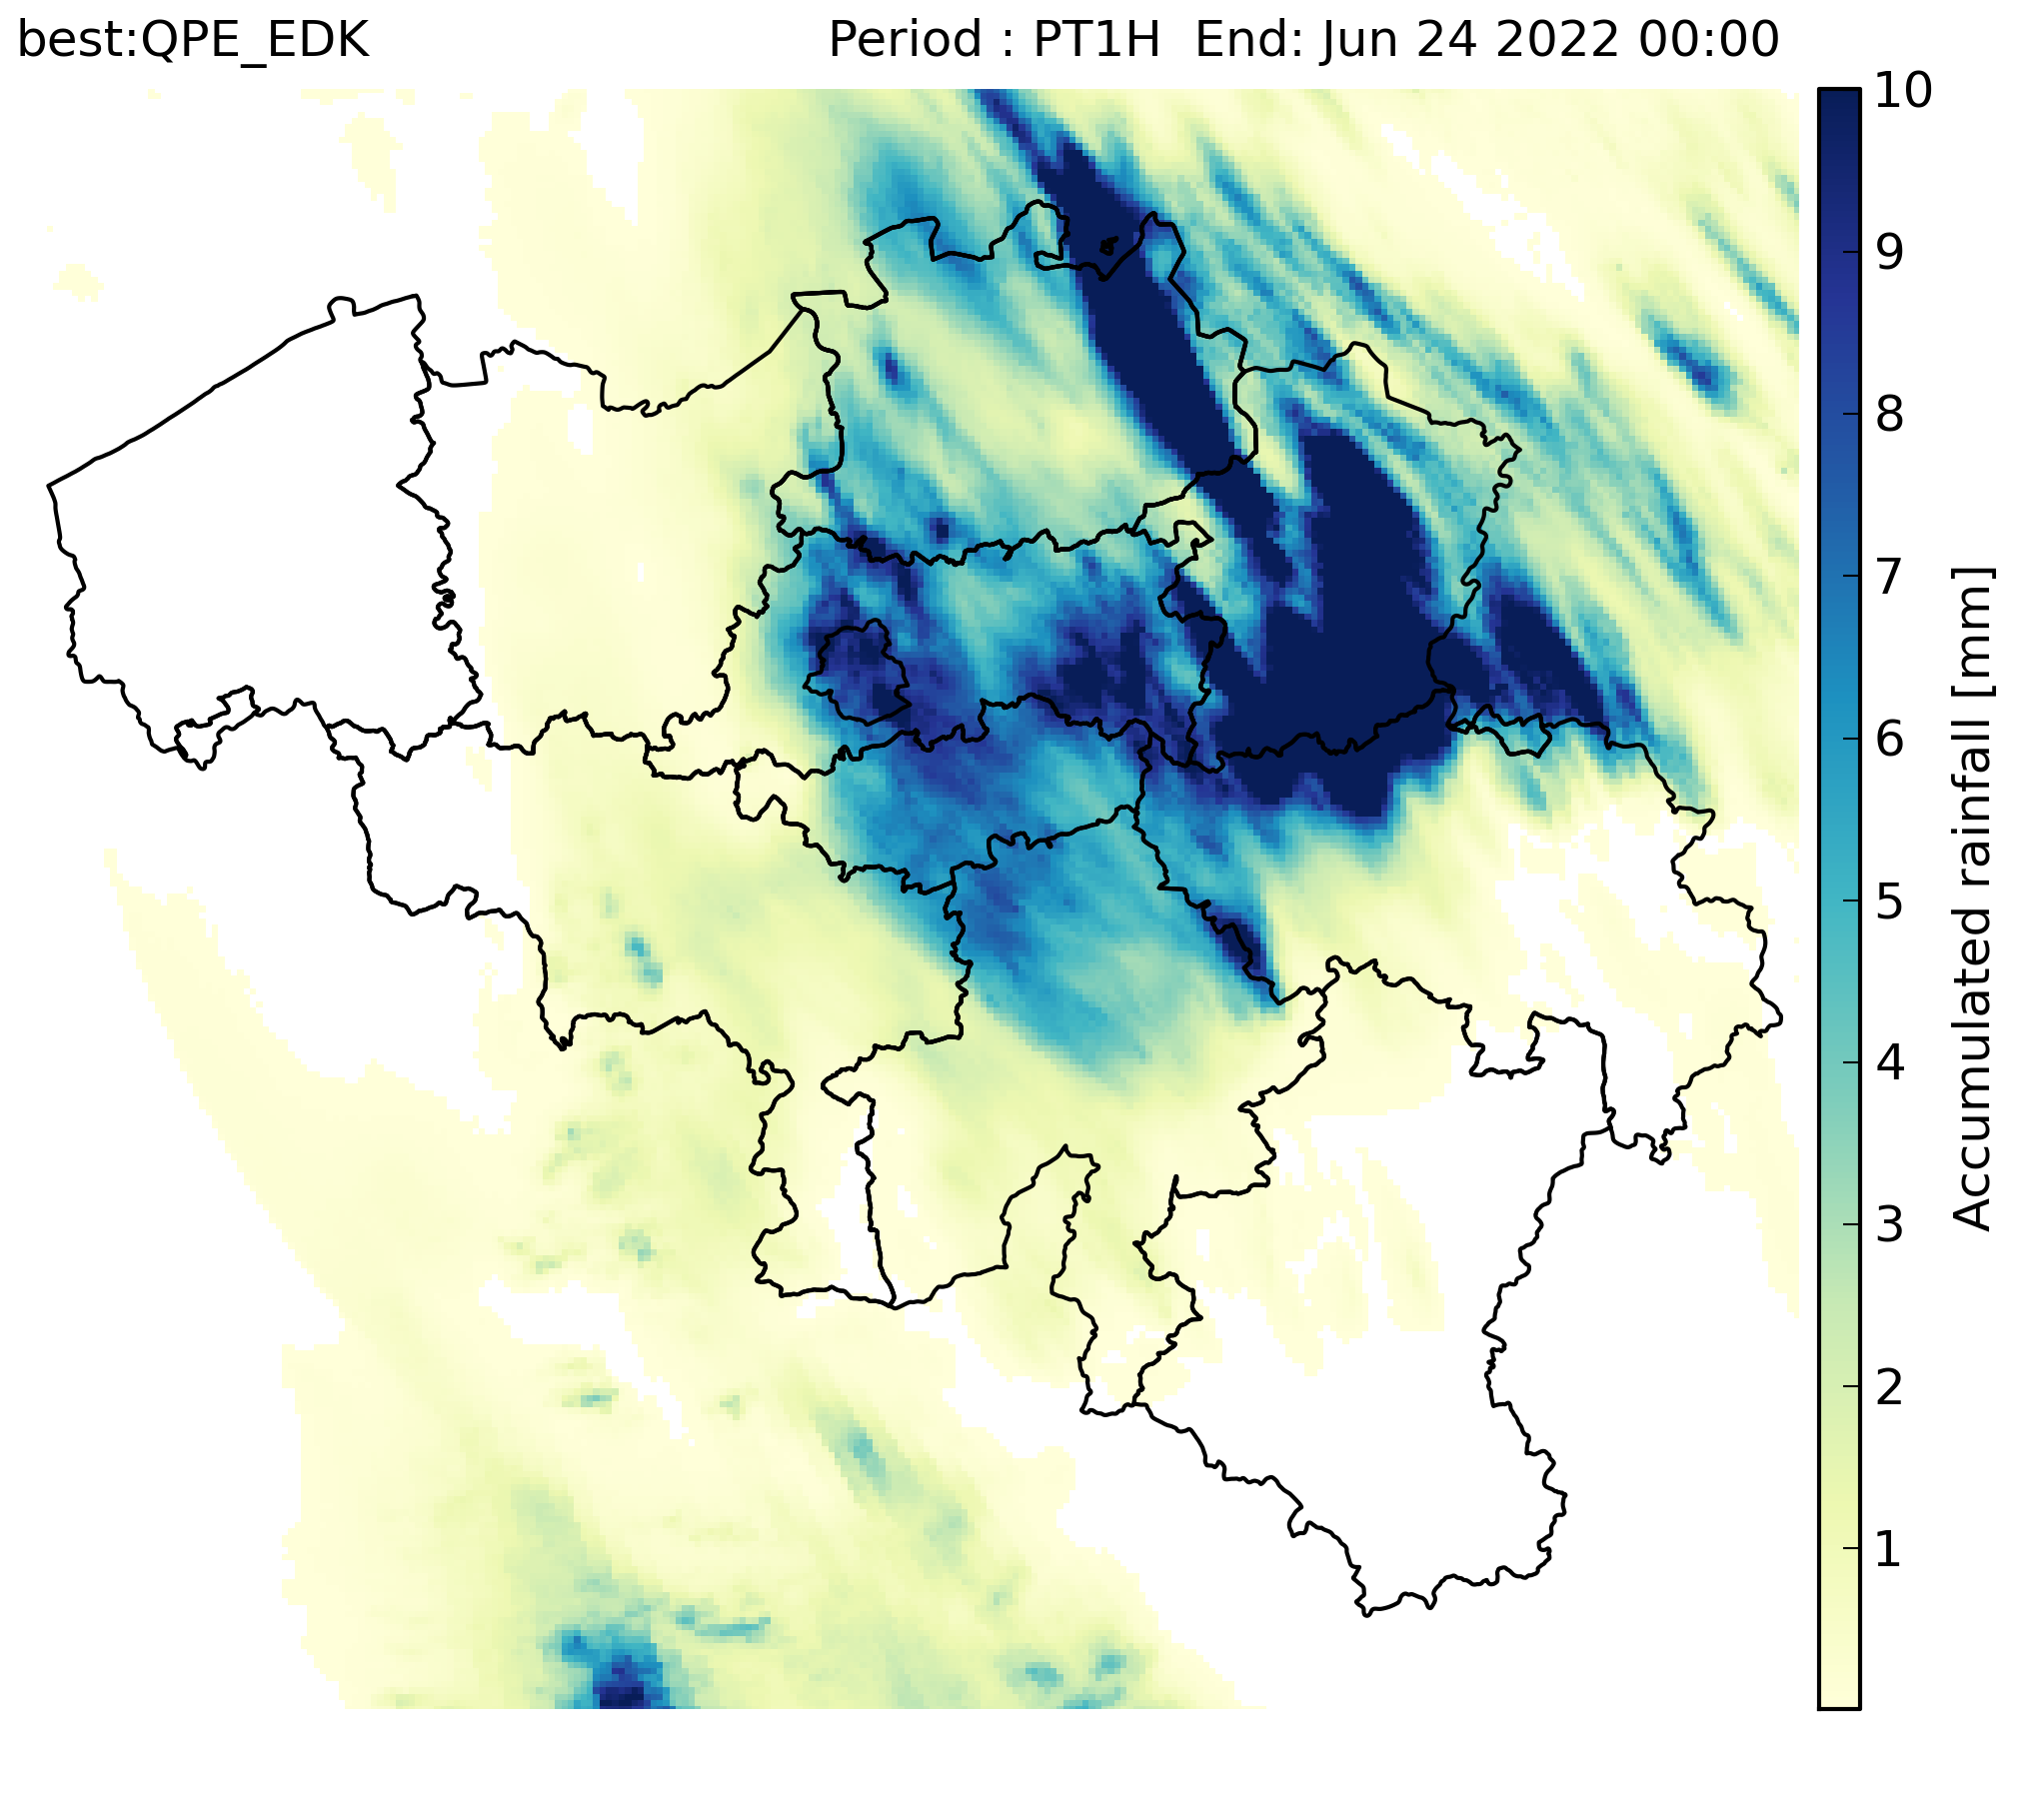
RADCLIM is a historical dataset based on weather radar observations that provides gridded accumulated precipitation composites over Belgium and surrounding regions. The data are distributed in ODIM_H5 version 2.2 format. The reported quantity is accumulated precipitation (ACRR) for 5-minute and 1-hour accumulation periods. UTC is used as the time reference, and the timestamp in the filename corresponds to the end of the accumulation period. The dataset is produced on a 700 × 700 grid with 1 km spatial resolution in the Belgian Lambert 2008 projection (Lambert Conformal Conic).
-
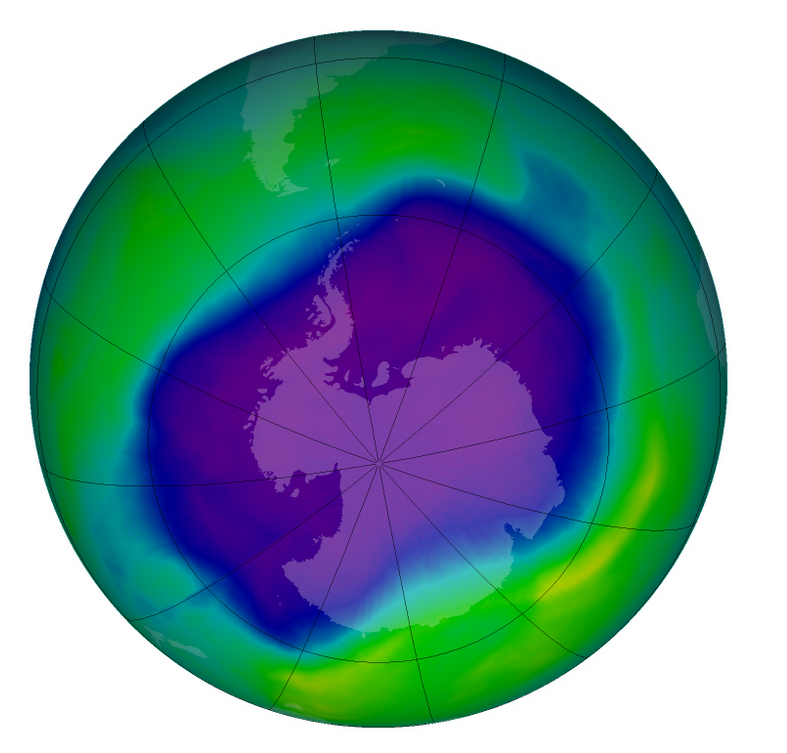
From multiple observations during the day with UV spectrophotometers a daily value of the ozone column is calculated. This product is not publically available yet.