 geo.be Metadata Catalog
Royal Meteorological Institute of Belgium
Type of resources
Available actions
Topics
INSPIRE themes
Keywords
Contact for the resource
Provided by
Years
Formats
Representation types
Update frequencies
status
Service types
Resolution
-
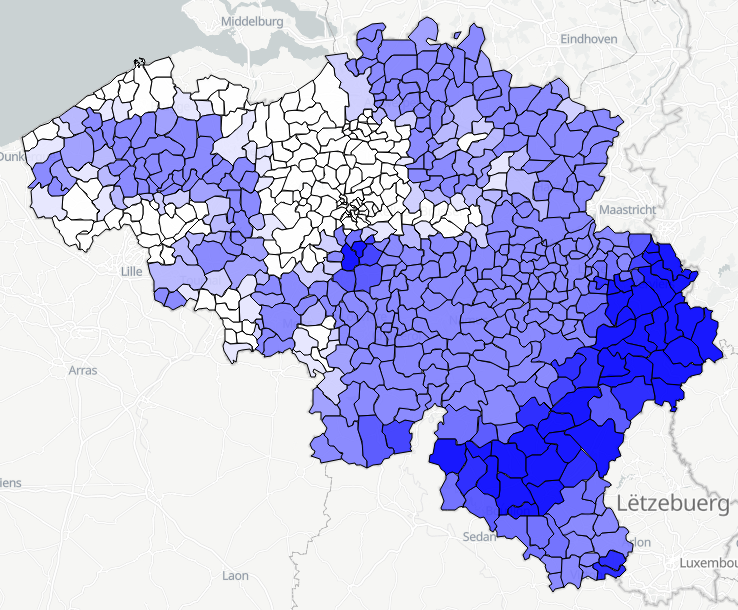
Daily forecasts for each Belgian commune, from current day up to the next 14 days. Available parameters are : min temperature, max temperature, weather type, wind speed, wind direction, maximum hust speed, quantity of precipitation. This product is not publicly available.
-
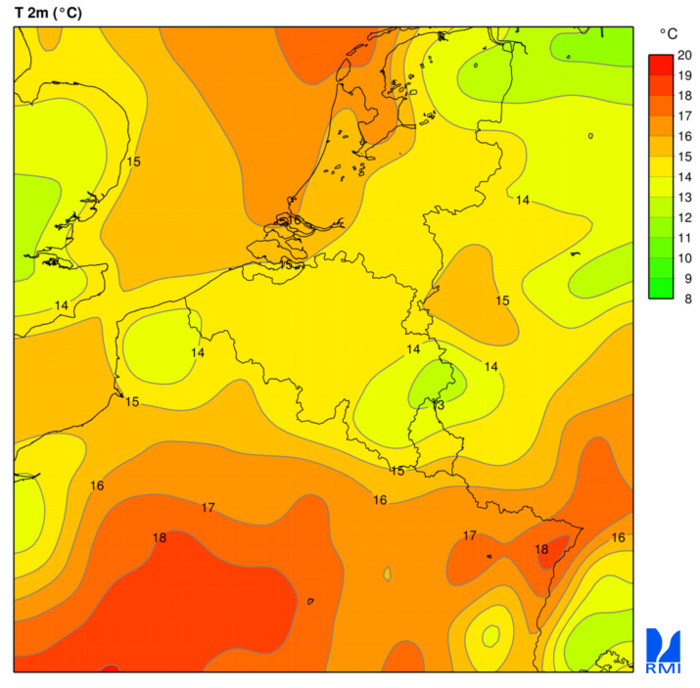
Download Service (WCS) for Alaro over Belgium. All the parameters of the last run of Alaro can be downloaded in grid format
-
Hail products are derived from the observed vertical profiles of radar reflectivity and the NWP vertical profiles of temperature. Three types of products are generated. poh : probability of hail of any size (larger than 0.5 cm diameter)expressed in %. posh : probability of severe hail(larger than 2cm)expressed in %. mesh : maximum expected size of hailexpressed in mm of hailstone diameter. All products are generated every 5 minutes. This product is not publically available yet.
-
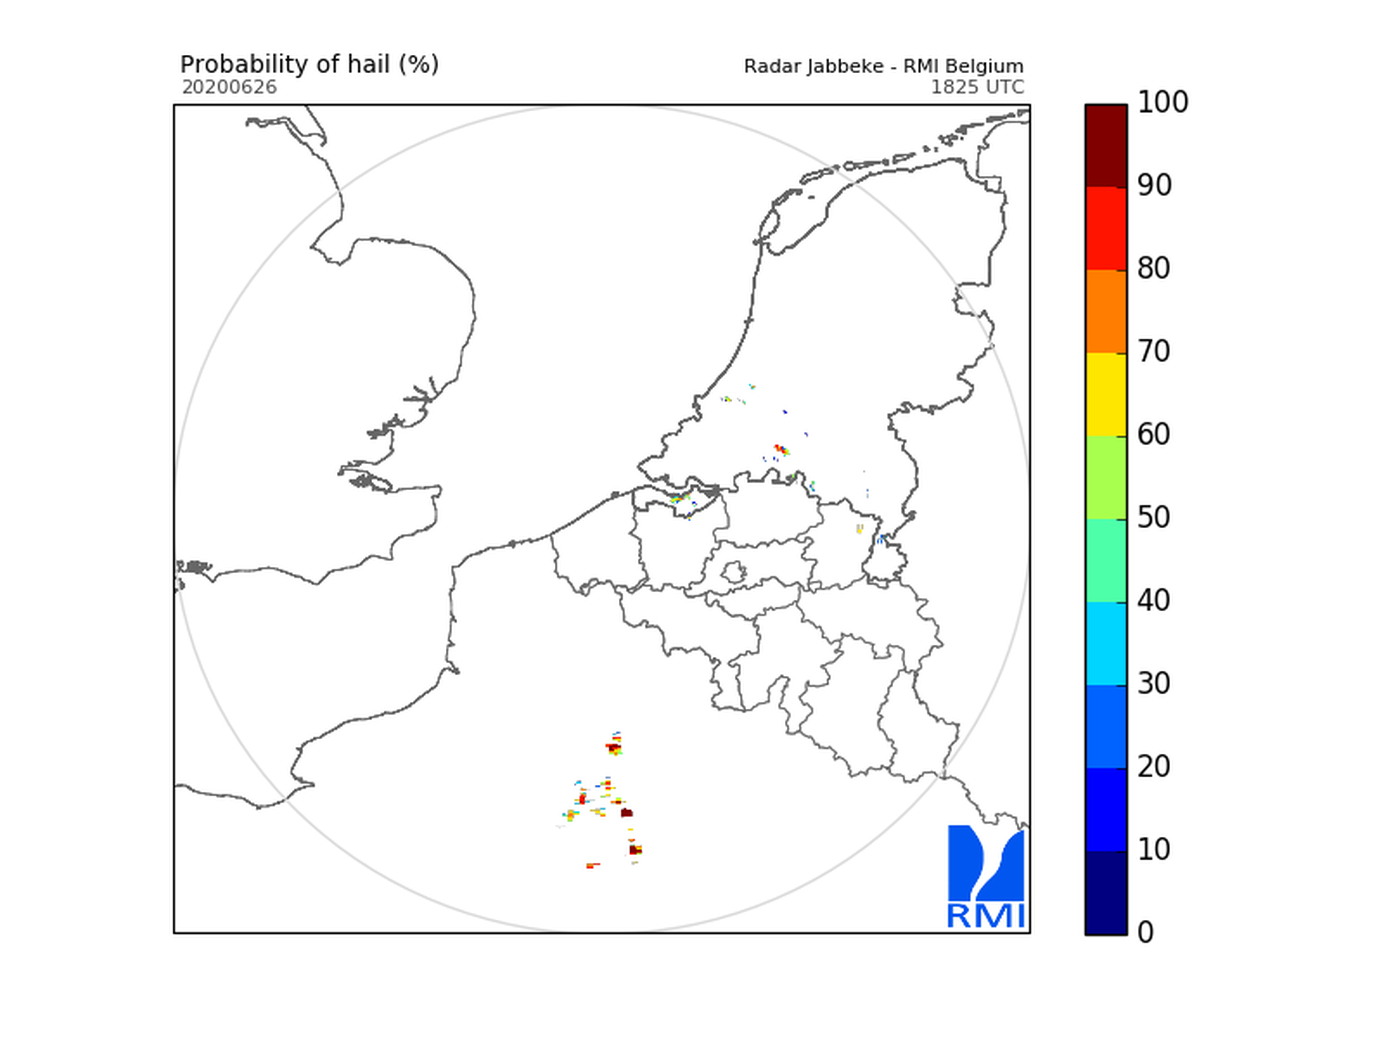
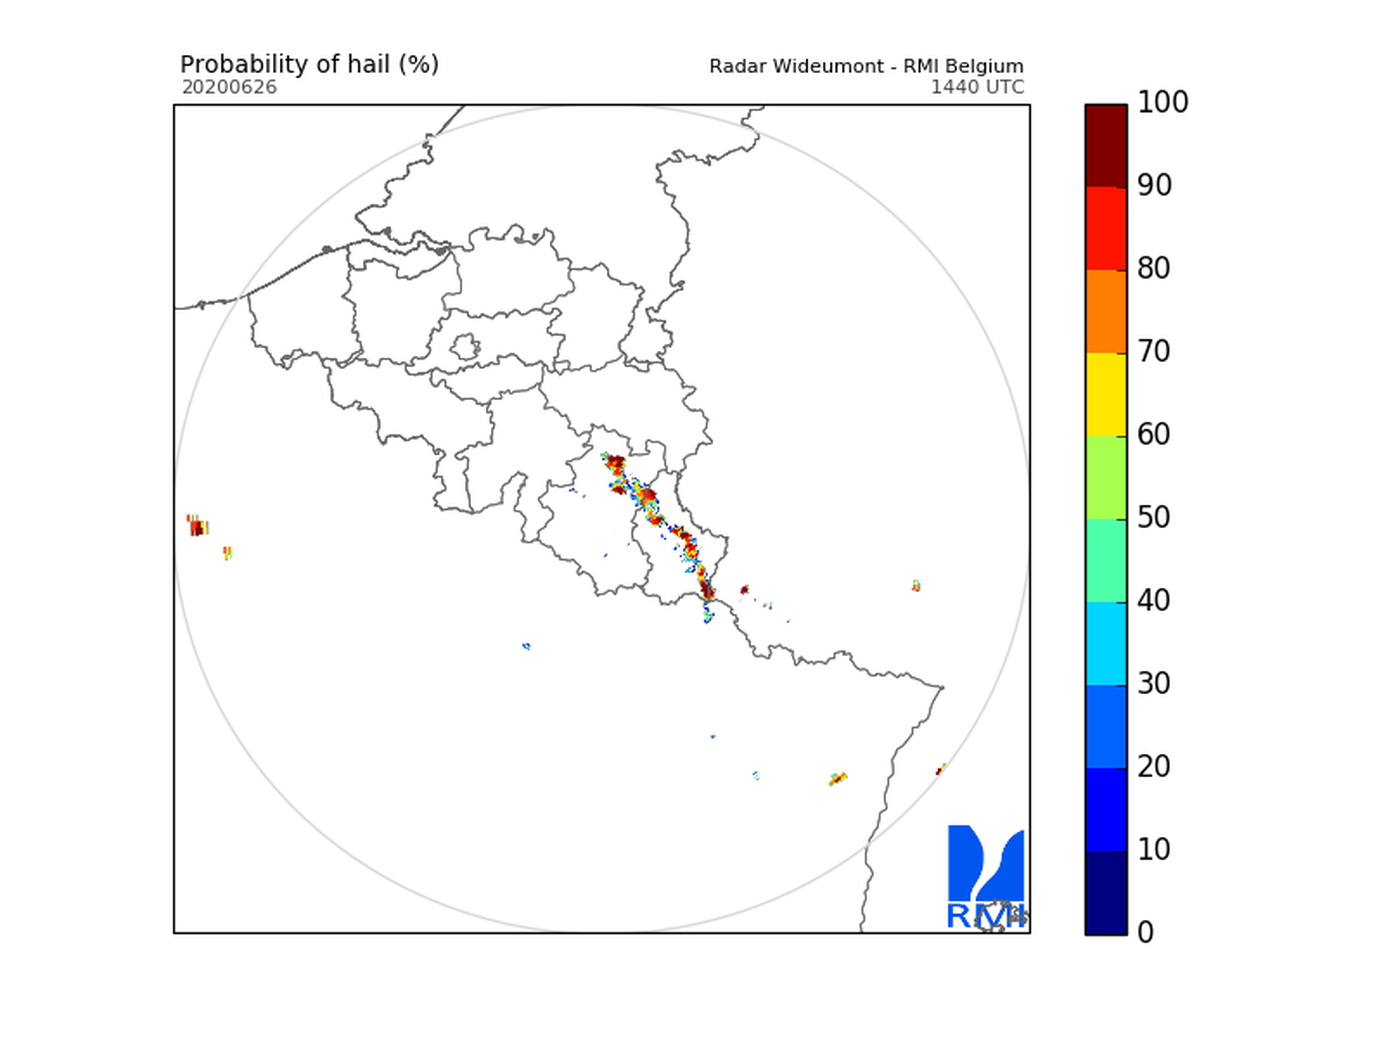
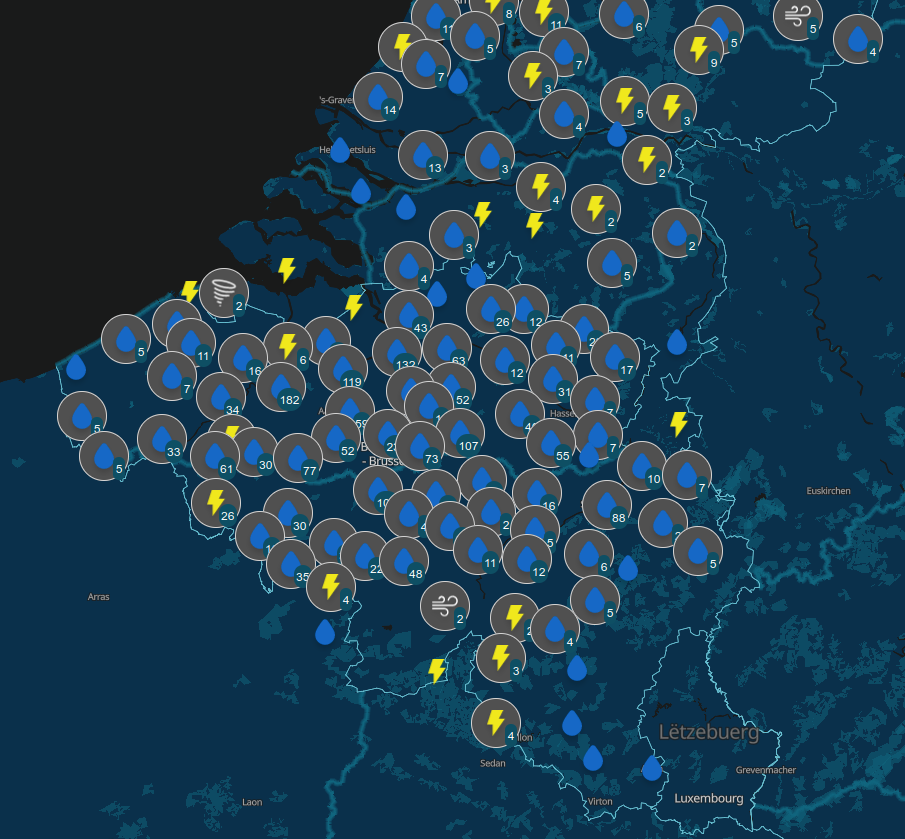
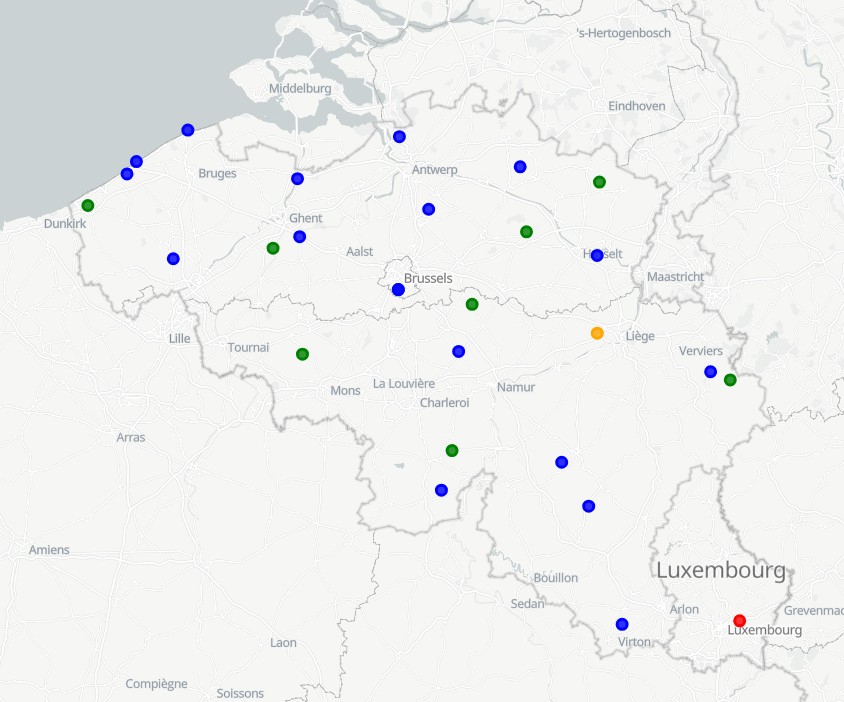
Since August 2019, users of the RMI smartphone app are able to send an observation of the meteorological conditions at a certain place and a certain time. The observations provide information about the weather conditions and potentially severe weather to the other users and to RMI. The collection of citizen weather reports is a valuable complement to the information obtained with the classical instruments like stations, radar and satellite. The data can be exploited for nowcasting, warnings and model verification, and eventually in assimilation. A general introduction of the data and their characteristics can be found in Reyniers et al. (2023). A basic quality control is implemented on the received observations via a plausibility check. This plausibility check determines whether an observation is plausible, suspicious or false, by comparing it to the INCA-BE nowcasting system using a simple thresholding scheme. INCA-BE is RMI's operational nowcasting system described in Reyniers et al. (2021). There is no strict spatial extent since there is no restriction at the input side: users can send observations from all over the globe. The bulk of the observations are received from within Belgium. Note that the plausibility check is not available for reports from outside Belgium.
-
-
Download Service (WFS) for Automatic weather station (AWS) observations
-
Hourly forecasts for each belgian commune, from current hour up to the next 5 days. This product is not publically available.
-
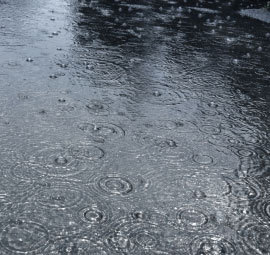
The data consists in tables of estimated extreme precipitation quantities for precipitation durations ranging from 10 minutes to 30 days and return periods ranging from 2 to 200 years for each Belgian municipality.