 geo.be Metadata Catalog
TIFF
Type of resources
Available actions
Topics
INSPIRE themes
federalThemes
Keywords
Contact for the resource
Provided by
Years
Formats
Representation types
Update frequencies
status
Scale
Resolution
-
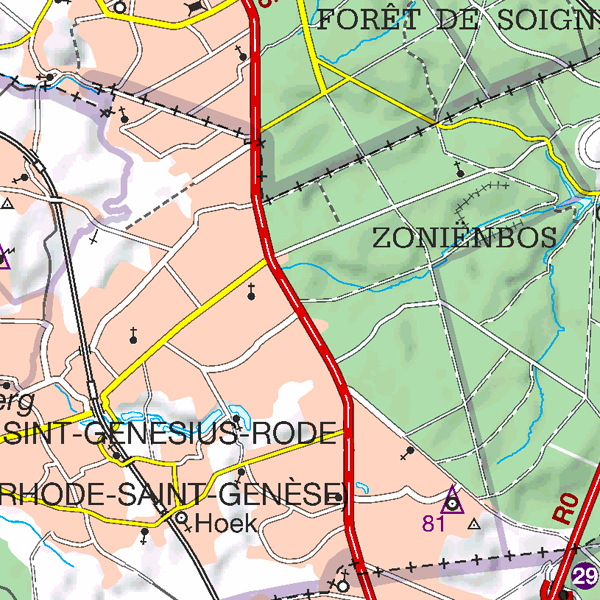
Landcover100Map is a digital version of the NGI’s topographic cartography on a scale of 1 :100 000. The images come from the symbolisation of the objects and the themes in the topo-geographic inventory of the Belgian territory (ITGI), which is built and kept up-to-date by the NGI. Landcover100Map is meant for a regional use on a larger scale than the one for Top50Map, typically on the scale of a province. The land use theme is very salient in this topographic cartography. The relief is represented by shadowing.
-
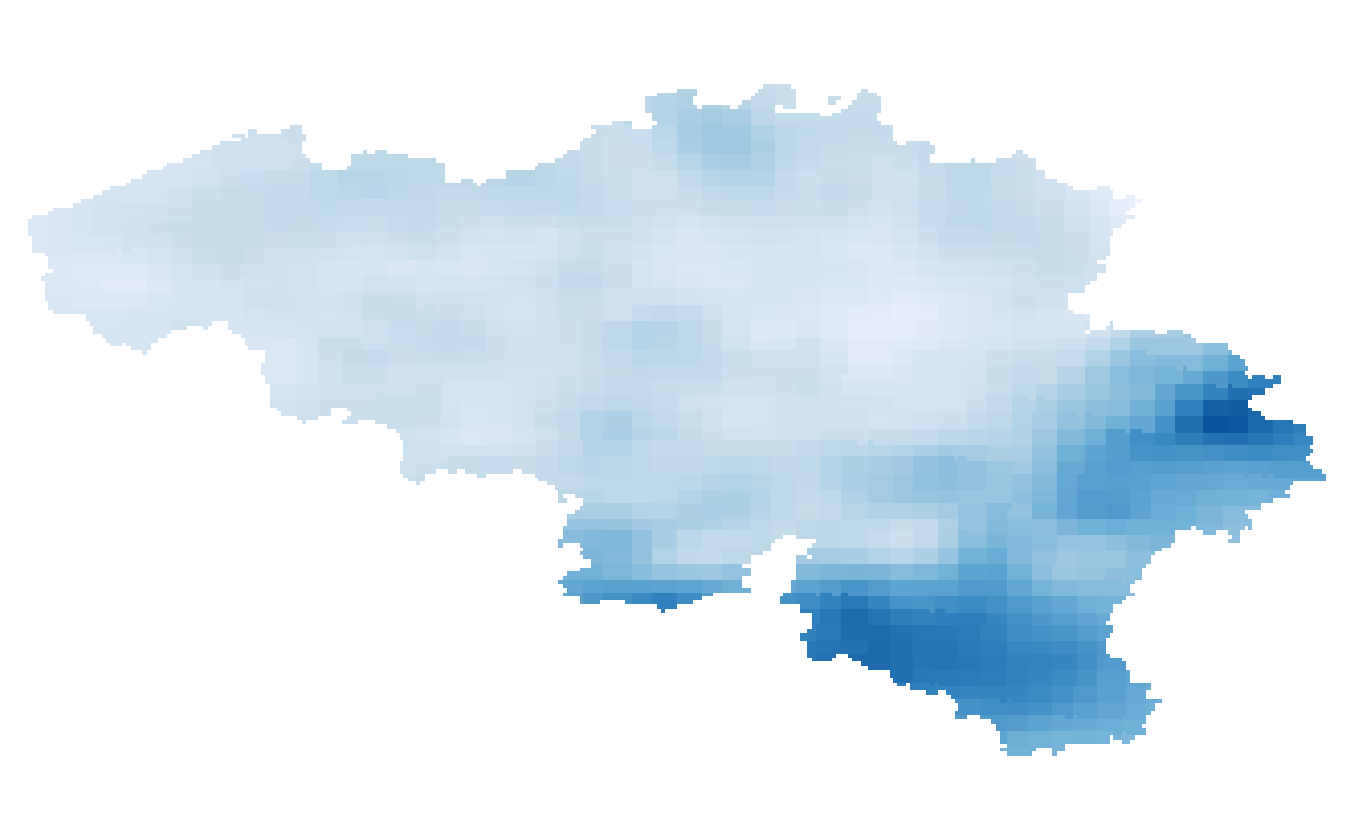
Annual, seasonal and monthly precipitation amounts given in respectively mm/year, mm/3 months and mm/month. The precipitation amounts are available for the future target year 2085, which corresponds to the middle of the 30-year period 2071-2100, and for mean and high impact scenarios corresponding to respectively the 50th, and 5th or 95th percentiles of the change factors.
-
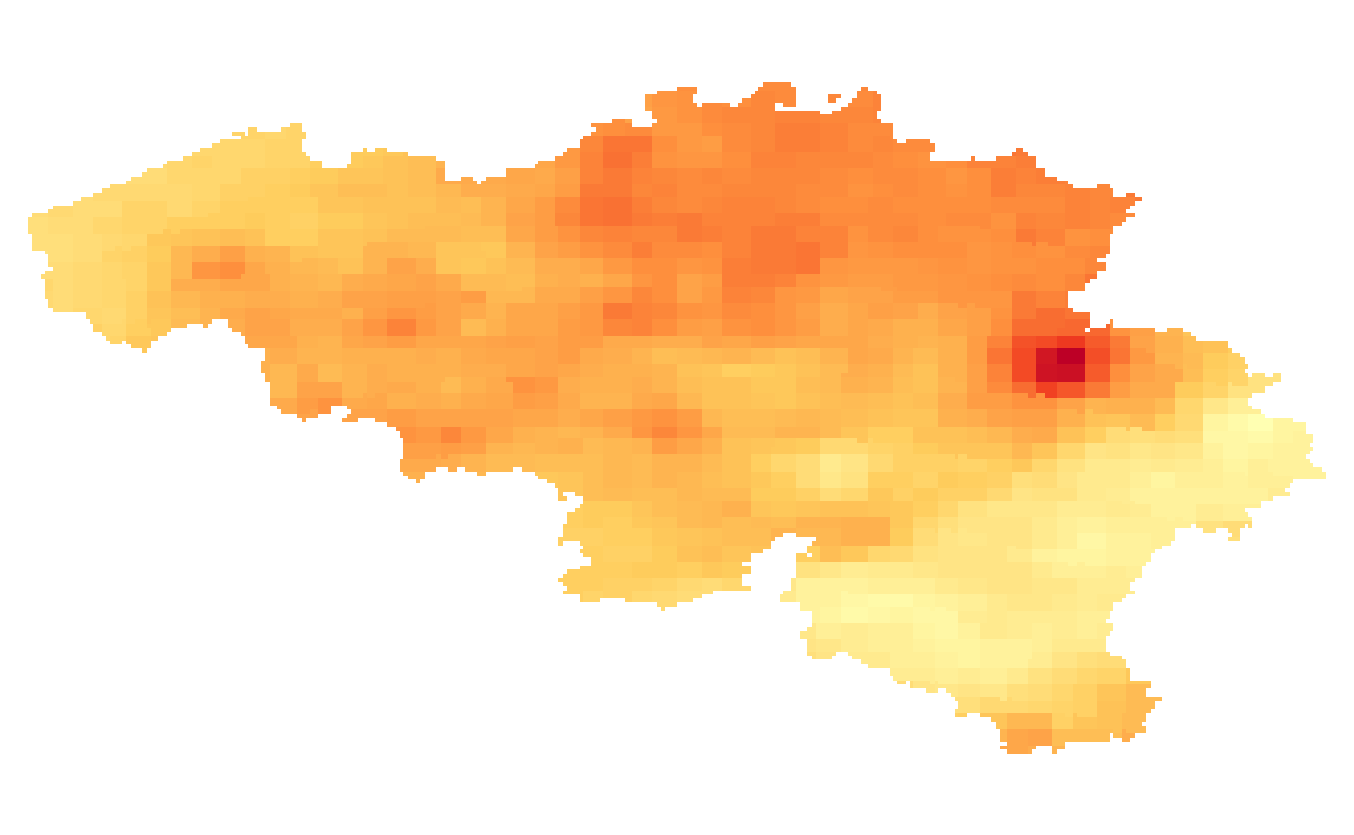
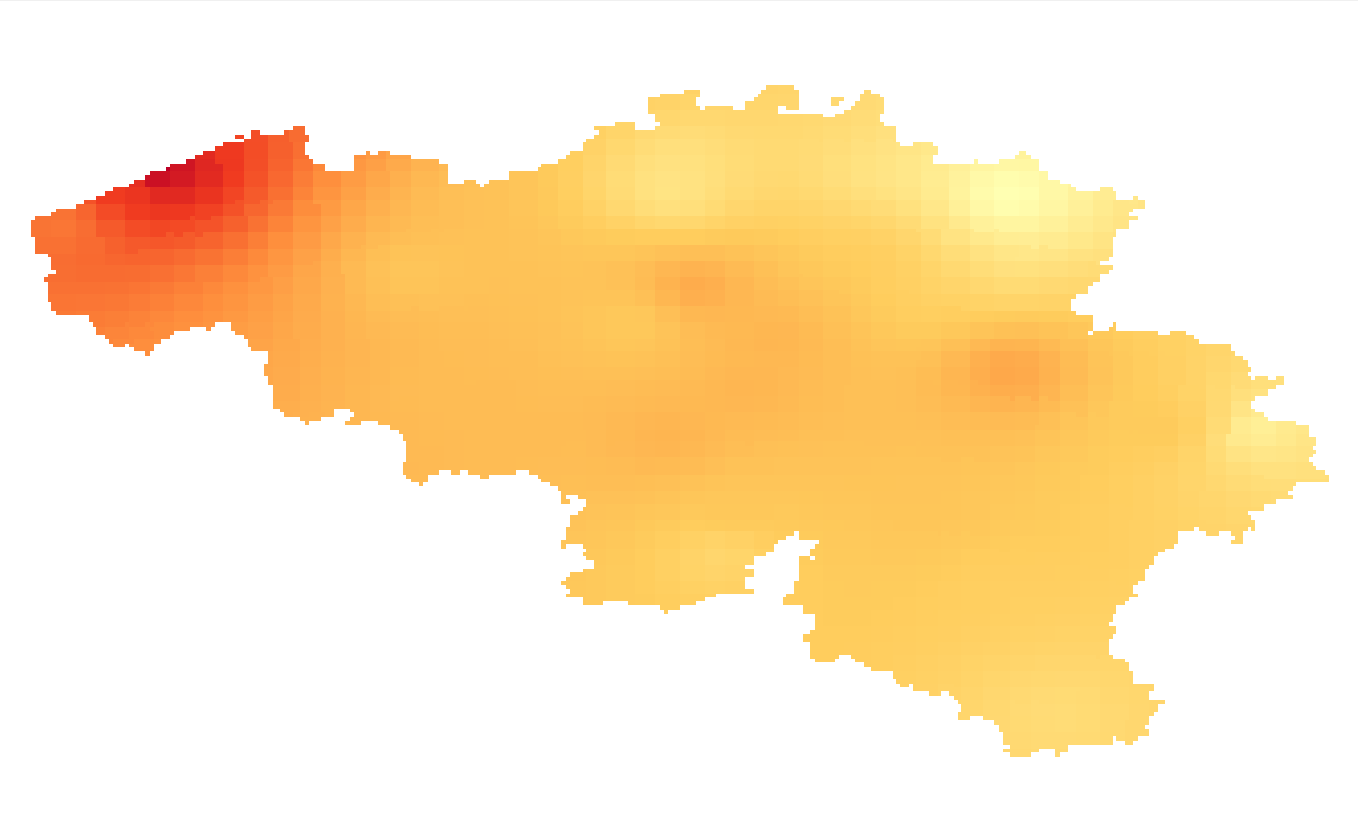
Annual temperature extremes given in number of days: 1/ Total number of heatwaves occurring once in 20 years; 2/ Maximum length of the heatwaves occurring once in 20 years; 3/ Hot days: Mean annual number of days with maximum temperature > 25°C; 4/ Tropical days: Mean annual number of days with maximum temperature > 30°C; 5/ Frost days: Mean annual number of days with minimum temperature < 0°C. Heatwaves are defined according to the Royal Meteorological Institute of Belgium when the maximum temperature in Uccle is >= 25°C during at least 5 consecutive days, during which at least 3 days the maximum temperature is >= 30°C. The temperature extremes are available for the present target year 1975, which corresponds to the middle of the 30-year period 1961-1990.
-
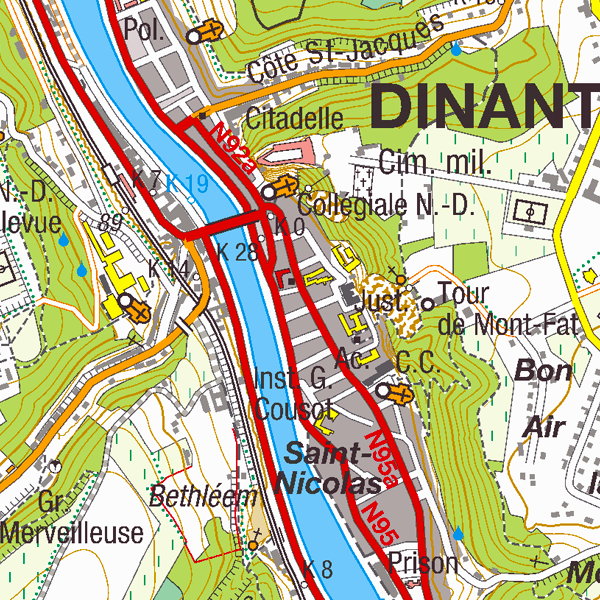
Top25Map is a digital version of the NGI’s topographic cartography on a scale of 1:25 000. These images result from the symbolisation of the objects and themes which are present in the topo-geographic inventory of the Belgian territory (ITGI), which is built and kept up-to-date by the NGI. Top25Map contains all usual themes of the NGI’s cartographic products (land use, transport, hydrography, buildings and constructions, relief,…), as well as the map lettering and the toponyms. The Top25Map cartography is appropriate to hiking.
-
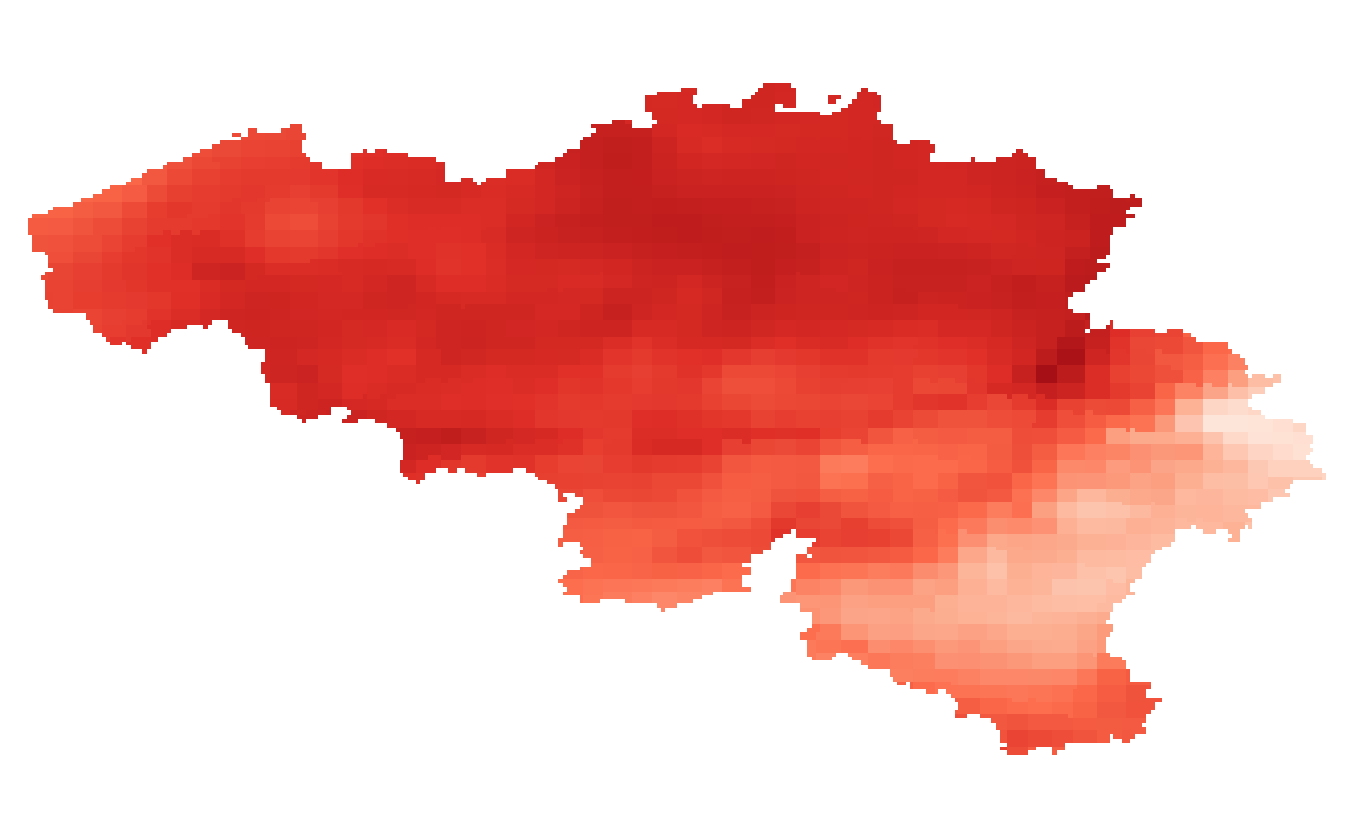
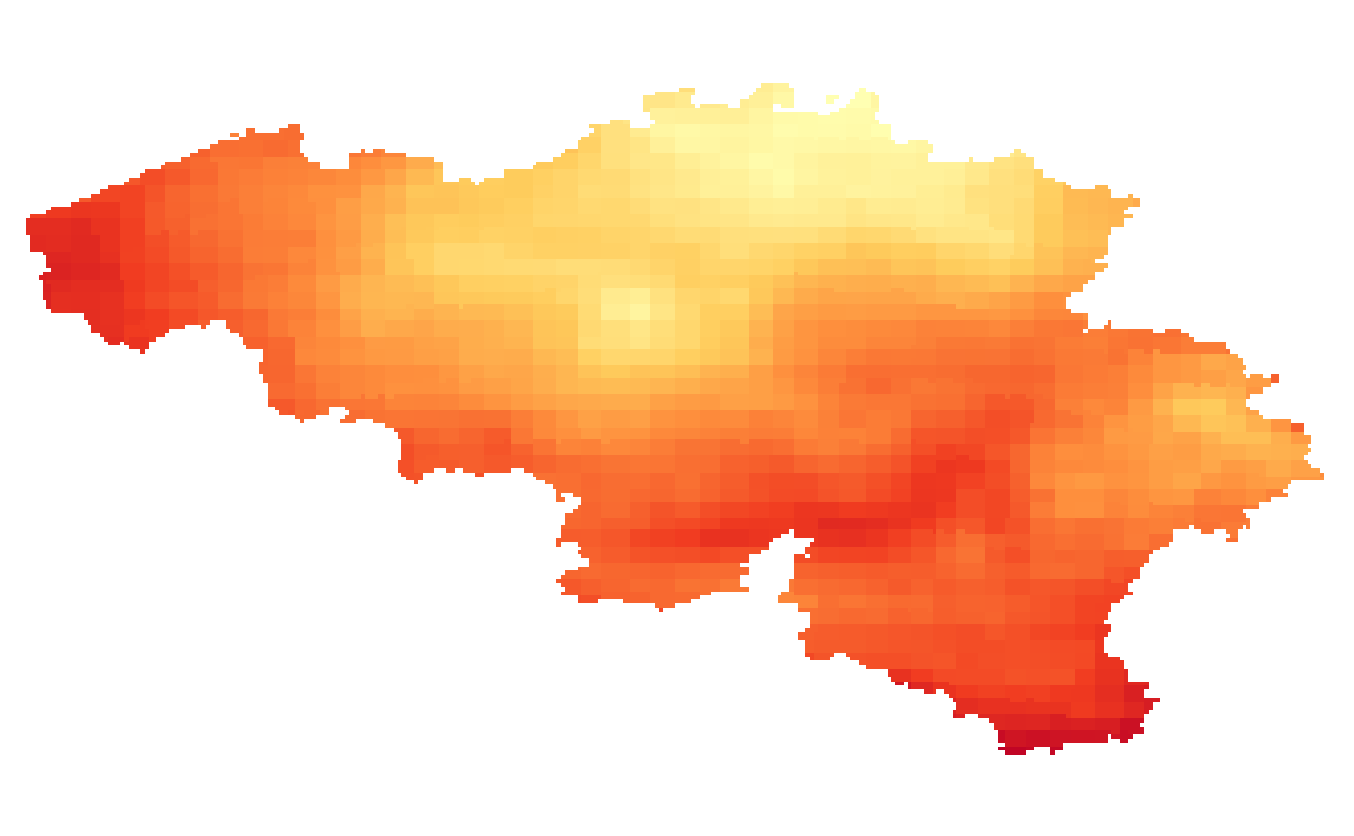
Summer and winter mean temperature given in °C. The temperature fields are available for the present target year 1975, which corresponds to the middle of the 30-year period 1961-1990.
-
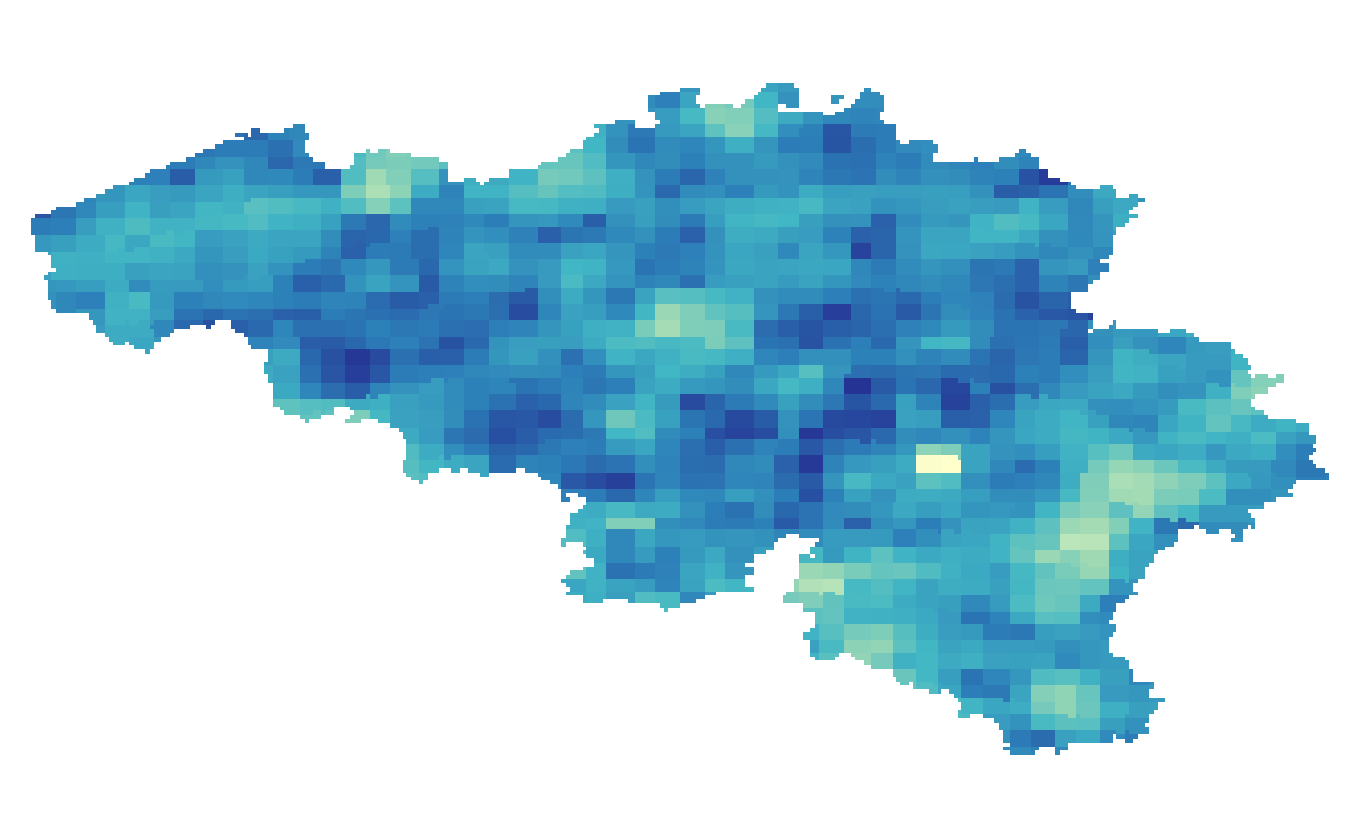
Annual and seasonal precipitation indices given in number of days: 1/ Wet days: Number of days with precipitation > 0.1 mm/day for winter, autumn, spring, summer; 2/ Dry days: Number of days with precipitation < 0.1 mm/day for winter, autumn, spring, summer; 3/ Average length of dry spells: Mean duration of minimum three consecutive days with precipitation < 0.1 mm/day; 4/ Maximum length of dry spells: Longest period of minimum three consecutive days with precipitation < 0.1 mm/day, occurring once in 20 years. The precipitation indices are available for the future target year 2085, which corresponds to the middle of the 30-year period 2071-2100, and for mean and high impact scenarios corresponding respectively to the 50th, and 5th or 95th percentiles of the change factors.
-
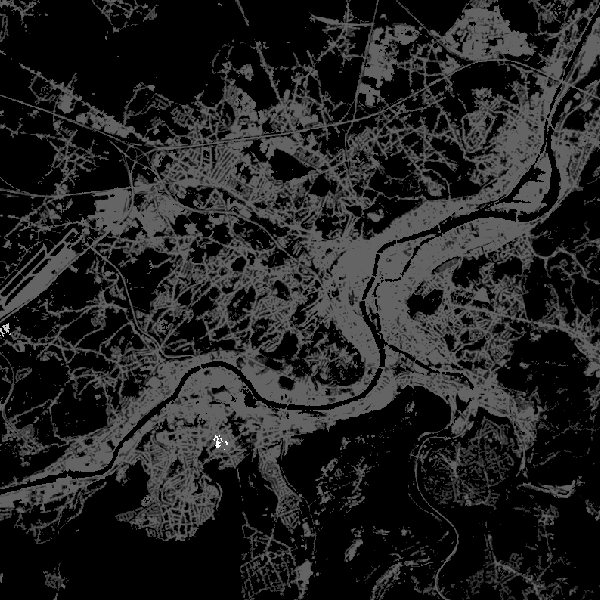
The product is made of 6 "high resolution layers" covering all the Belgian territory as part of a European-wide coverage. The 6 layers concern 6 distinct themes: Imperviousness, Tree cover density, Forest type, Permanent grasslands, Wetlands and Permanent waterbodies. The 6 layers were produced by an automatic classification based on satellite images and collateral data and achieved by private companies (EEA service providers), and they were verified and enhanced by Belgium. At the Belgian level, verification and enhancements were made by AGIV for the northern part and SPW for the southern part. The NGI coordinated the project.
-
Annual, seasonal and monthly precipitation amounts given in respectively mm/year, mm/3 months and mm/month. The precipitation amounts are available for the present target year 1975, which corresponds to the middle of the 30-year period 1961-1990.
-
Summer and winter mean wind speed given in m/s. The wind speed fields are available for the present target year 1975, which corresponds to the middle of the 30-year period 1961-1990.
-
Summer and winter mean global solar radiation given in kWh/m²/day. The global solar radiations fields are available for the future target year 2085, which corresponds to the middle of the 30-year period 2071-2100, and for mean and high impact scenarios corresponding respectively to the 50th and 95th percentiles of the change factors.