 geo.be Metadata Catalog
Type of resources
Available actions
Topics
INSPIRE themes
federalThemes
Keywords
Contact for the resource
Provided by
Years
Formats
Representation types
Update frequencies
status
Service types
Scale
Resolution
-

This AtomFeed download service provides access to federal datasets that are not reported under the INSPIRE Directive. The datasets can be accessible for free or under conditions.
-
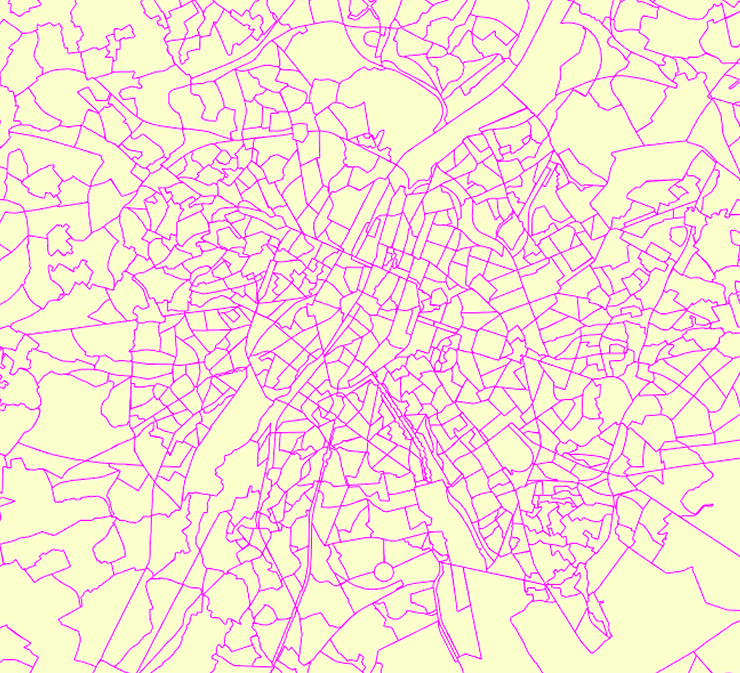
The data set has been established according to the INSPIRE format. It presents in the form of polygons the breakdown of Belgium in almost 20,000 statistical sectors. The statistical sector is the basic territorial unit resulting from the subdivision of the territory of municipalities by STATBEL since 1970 for the dissemination of its statistics at a finer level than the municipal level. A statistical sector cannot extend over two municipalities and any point in the municipal territory is part of one and the same statistical sector. The 1970 and 1981 versions are shown in analogue format while the 2001, 2011, 2018, 2019 etc. versions are available in digital vector format. The files can be linked to the data on population, housing and disposable income on the website of Statbel.
-
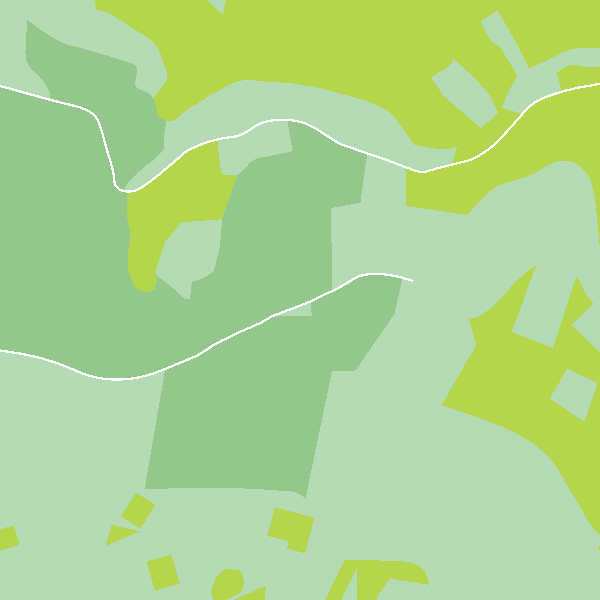
‘Top10Vector – Land cover and Vegetation’ is the vector dataset of the land use categories of undeveloped land areas in Belgium. This dataset comprises 3 feature types, namely isolated [LC_isolatedvegetation] and linear [LC_linearvegetation] vegetation and land cover zones [LC_landcoverzone]. This dataset can be downloaded via the links in ‘Access’ at the bottom of this page.
-
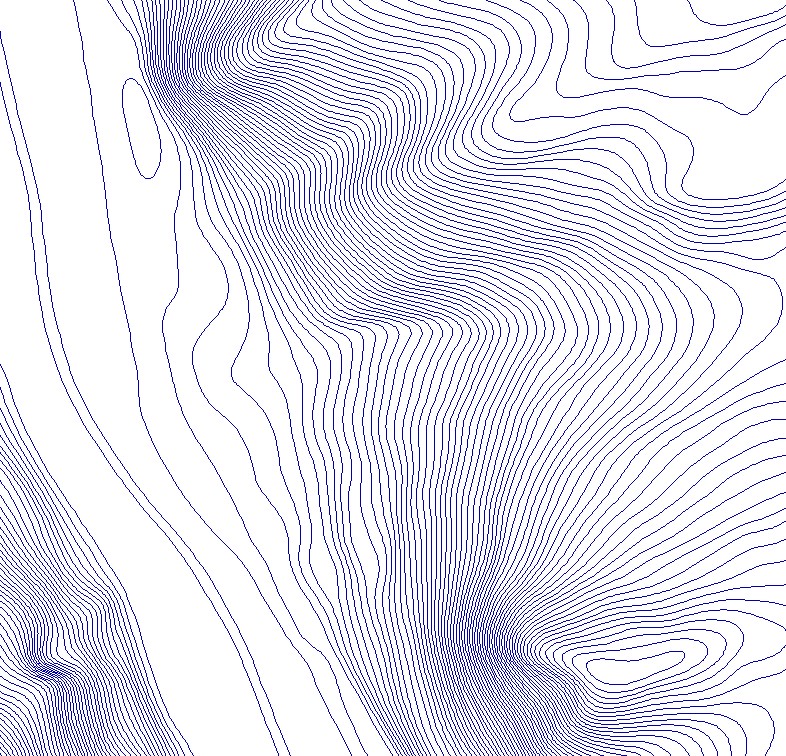
The contour lines are the set of lines connecting all points at the same elevation in a model used to represent the relief on a large scale.
-
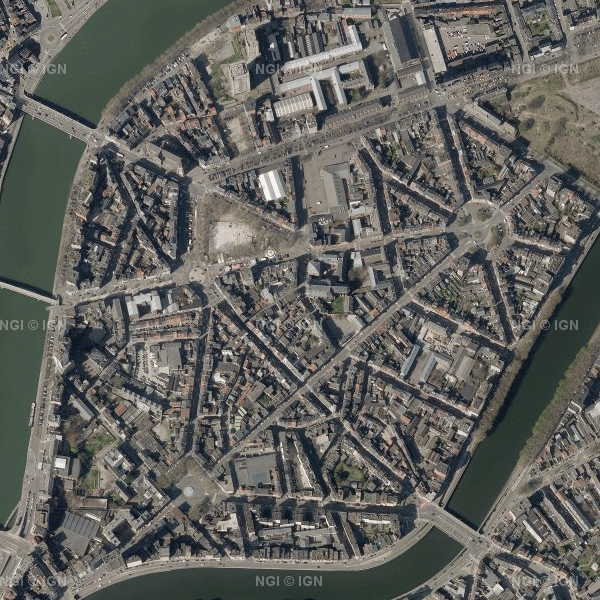
This dataset contains the most recent orthophoto mosaics for the Belgian territory. Orthophotos are aerial photographs that have been geometrically corrected (orthorectification) to eliminate distortions caused, among other things, by terrain, the camera lens and the camera viewing angle. As a result, they have accurate geometry and can be used for cartography, measurements and visual analysis, among other applications. The orthophoto data are provided by the Belgian administrative Regions and integrated by the National Geographic Institute (NGI) into a single national coverage. The transitions between the orthophotos from the different Regions are carefully adjusted to create a seamless and visually homogeneous whole. The dataset is updated annually with the most recent orthophoto data. The aim is to provide complete national orthophoto coverage every year. However, not every year provides complete coverage of Belgium. In such cases, the national coverage is supplemented with orthophotos from previous years. The dataset is updated in phases. For the 2026 edition, orthophoto tiles for Wallonia are currently available. The data for Flanders will be added as soon as they become available. The 2026 data can currently be downloaded, but have not yet been included in the WMS/WMTS web services. All orthophotos are colour images (RGB). The ground sampling distance (GSD) is 25 cm in Wallonia and 12.5 cm in Flanders and the Brussels-Capital Region. Since 2026, the orthophoto mosaics have been divided into tiles according to the NGI 25K grid, a fixed geographical grid covering the Belgian territory. The data can be downloaded as compressed JPEG2000 files (JP2), together with the corresponding world file (.j2w) and metadata describing the extent. The dataset is INSPIRE-compliant.
-
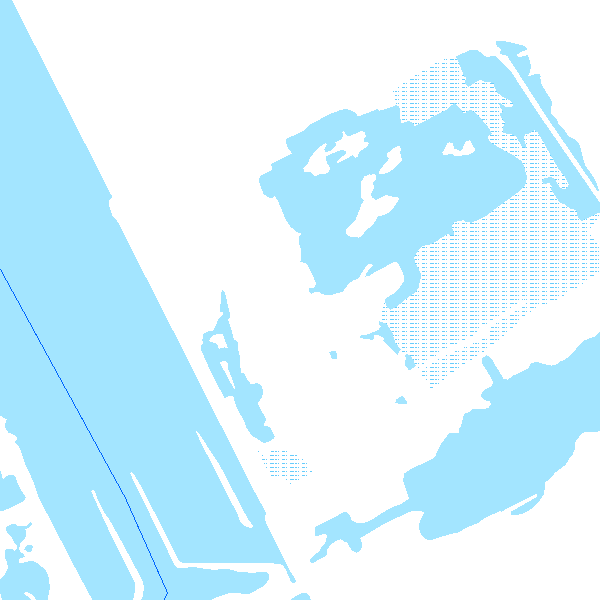
The entities included in the dataset represent the physical network in the sense of the Inspire European directive. The dataset comprises several classes and is in accordance with the INSPIRE specifications. The Wetland class represents poorly drained or periodically flooded portions of land, the soil of which is saturated with water but where vegetation is nevertheless able to develop. The StandingWater class represents flooded areas that are, nevertheless, completely surrounded by land.
-

Landuse-Particular Zone is the INSPIRE 2D vector data set of the "Particular zones" layer originated from the Top10vector product of the National Geographic Institute in Belgium . It includes the "ExistingLandUseDataSet" features and the "ExistingLandUseObject" features in accordance with the INSPIRE specifications.
-
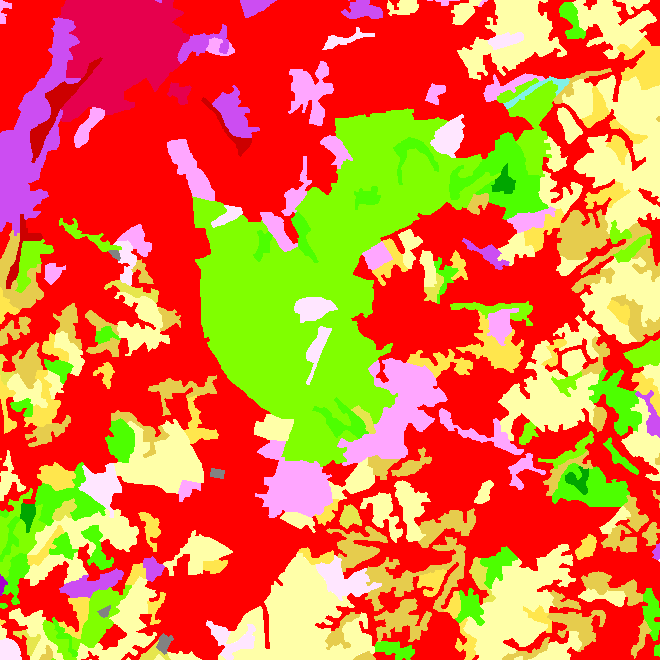
The data set contains a seamless polygonal layer representing the land cover in Belgium for the year 2018. The dataset is INSPIRE compliant.
-
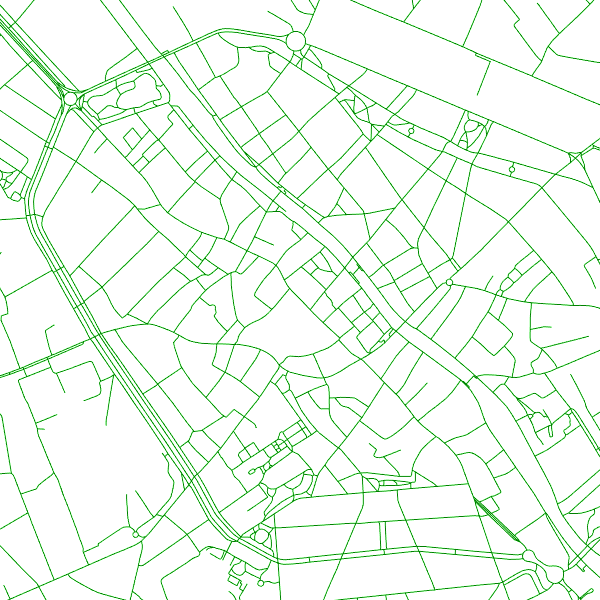
The entities included in the dataset represent the Belgian road transport network in the sense of the INSPIRE European directive. The dataset comprises several classes. The RoadLink class represents, in a linear manner, all of the road links between each pair of dots for the network considered. The footpaths, cycle paths or carriageways that connect the pairs of dots correspond to as many entities in the class. The RoadServiceArea class represents the sections of space devoted to auxiliary road transport functions, such as service stations or rest areas. In addition to this are two classes without geometry. RoadWidth class describes in metres the width of each segment of the "road links" class. The "functional importance" class ranks the segments of the "road links" class by functional importance on the road transport network.
-
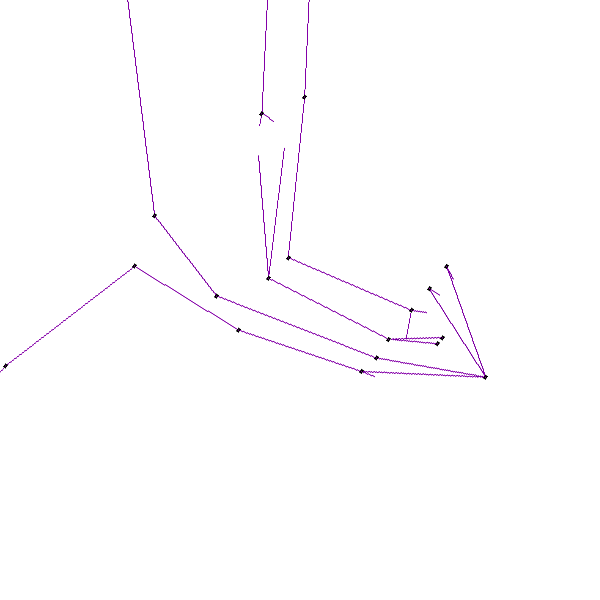
Electricity network is the INSPIRE vector data set originated from the High-Tension network of the product TOP10Vector of the National Geographic Institute in Belgium. The Electricity network is regularly updated with the ELIA Group data sources. It includes the "ElectricityCable" features and the "Pole" features in accordance with the INSPIRE specifications.