 geo.be Metadata Catalog

Type of resources
Available actions
Topics
INSPIRE themes
Keywords
Contact for the resource
Provided by
Years
Formats
Representation types
Update frequencies
status
Service types
Resolution
-
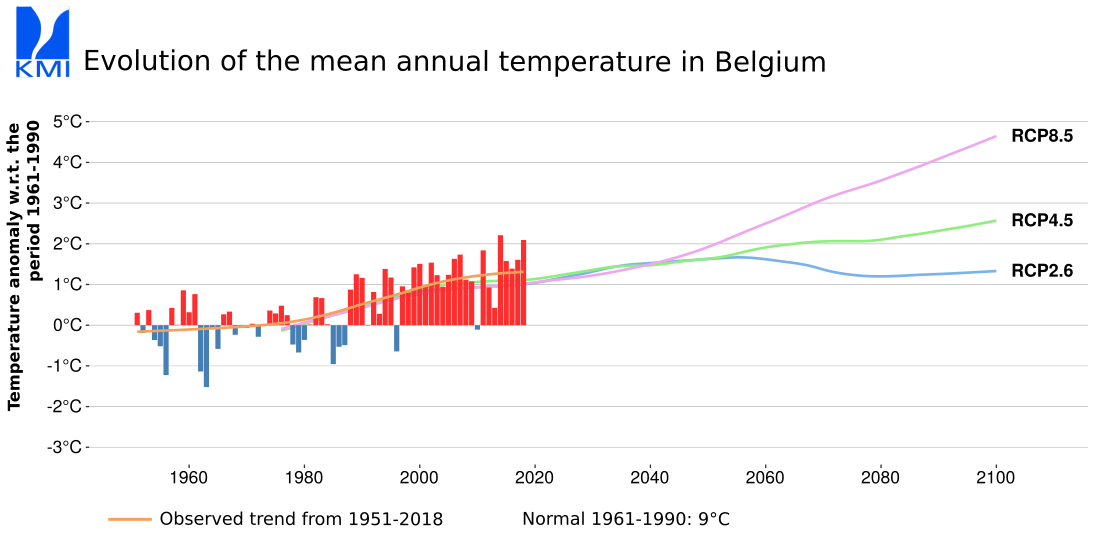
Regional Climate Model: ALARO-0 model This data includes spatially-detailed climate projections for Belgium and can be used for climate-change impact assessments (historical and RCP simulations) and analysis of past climate (evaluation simulation). Note that the historical run will, by construction, not correspond to past observations. For further details please contact RMI or cordex@meteo.be. This dataset has been obtained by dynamical downscaling using the regional climate model ALARO-0 (Termonia et al., 2018a) in the context of the BELSPO-funded project CORDEX.be (Termonia et al, 2018b, www.euro-cordex.be). The downscaling methodology is in line with the guidelines of the Coordinated Regional Downscaling Experiment (CORDEX; Jacob et al. 2014) and follows the climate scenario's RCP2.6, RCP4.5 and RCP8.5 as suggested by the Intergovernmental Panel on Climate Change. The spatial resolution of the data is 4-km and the domain covers a region centered over Belgium. The temporal resolution of the data is daily over long continuous periods. The historical experiment covers the period 1976-2005 and the RCP scenarios cover the period 2007-2100. Precipitation data has undergone thorough validation (Van de Vyver et al., 2021) and investigation (Helsen et al., 2020). The 4-km simulations were performed in a double (one-way) nesting setup where the Belgian domain was nested in an ALARO-0 run over the EURO-CORDEX domain (Berckmans et al, 2021) with a resolution of 0.44° (≃ 50 km) and validated in Giot et al. (2016). Around Europe the latter was forced by the global climate model CNRM-CM5 (historical, RCP 2.6, RCP 4.5, RCP 8.5) that has a resolution of about 1.4° (≃ 155 km) and is part of the Coupled Model Intercomparison Project CMIP5. Giot et al., 2016. DOI: 10.5194/gmd-9-1143-2016 Helsen et al., 2020. DOI: 10.1007/s00382-019-05056-w Termonia et al., 2018a. DOI: 10.1016/j.cliser.2018.05.001 Termonia et al., 2018b. DOI: 10.5194/gmd-11-257-2018 Jacob et al., 2014. DOI: 10.1007/s10113-013-0499-2 Van de Vyver et al., 2021. DOI: 10.1175/JAMC-D-21-0004.1 Further info can be found on https://cordex.org/experiment-guidelines/ http://www.belspo.be/belspo/brain-be/projects/FinalReports/CORDEXbe_FinRep_AD.pdf Periods: * present climate: HIST_1975_2005 * future climate, 3 emission scenarios RCP 2.6, RCP 4.5, RCP 8.5: RCP26_2007_2100, RCP45_2007_2100, RCP85_2007_2100 Variables: 1. et0 = Reference Evapotranspiration [kg m-2 s-1]; to get this in mm/day, the data should be multiplied by 60*60*24 = 86400. It is calculated following the FAO method (Allen et al., 1998) using the Penman-Monteith equation for reference (potential) crop evapotranspiration 2. hurs = relative humidity [%] 3. pr = precipitation [kg m-2 s-1]; to get precipitation in mm/day, the data should be multiplied by 60*60*24 = 86400 4. rsds = global solar radiation [W m-2] 5. sfcWind = wind at 10 m [m s-1] 6. tas = near-surface (2 m) air temperature at 2 m [K] 7. tasmax = daily maximum near-surface (2 m) air temperature [K] 8. tasmin = daily minimum near-surface (2 m) air temperature [K] 9. et0 = Reference Evapotranspiration [kg m-2 s-1]; to get this in mm/day, the data should be multiplied by 60*60*24 = 86400
-
A climate normal is an average over a 30-years period. The period 1981-2010 is the current reference period recommended by the World Meteorological Organization (WMO). Recent climate normals are available for any locations in Belgium and several parameters including air temperature, precipitations and solar radiation. Climate normals for the reference period 1981-2010 are available for air temperature, precipitation and derived parameters (e.g., annual number of summer days, annual number of precipitation days, etc.). For solar radiation, the reference period had to be adjusted to 1984-2013 because of data availability. These climate normals are available as maps and as table for each Belgian municipality.
-
Daily forecasts for each belgian commune, from current day up to the next 7 days. This product is not publically available.
-
The data consists in tables of estimated extreme precipitation quantities for precipitation durations ranging from 10 minutes to 30 days and return periods ranging from 2 to 200 years for each Belgian municipality.
-
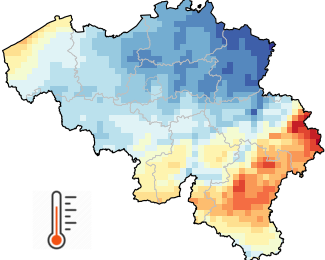
Gridded observational data provides an estimate of the spatial distribution of a meteorological variable based on observations. While instrumental measurements are taken at irregularly distributed stations, gridded data represents the meteorological variable on a predefined regular grid. Gridded observational data is of strong benefit in disciplines applying distributed quantitative models to examine the influence of weather and climate. Gridded data are also very convenient to provide estimations for any specific location of interest for the user. Gridded observational data covering Belgium at a spatial resolution of 5 km (= 1360 pixels) are available for several variables (precipitations, air temperature, sunshine duration, solar radiation, relative humidity and wind speed) as well as different temporal resolutions (daily, monthly, seasonal, annual values as well as long-term climate averages). The gridded database starts in 1961 for most variables and is updated each day with the available observations of the previous day. All grids are then updated for archiving as soon as the data quality control is completed. In addition to the 5km x 5km grids, spatial averages for all each Belgian municipality are also available. This product is not publically available yet.
-
Weather model INCA. Available parameters : 2m Temperature, 2m Dewpoint, 2m Relative Humidity, Snowfall level, Freezing level, 3D Temperature, 3D Humidity, 3D Wind, 10m Wind, 10m Gusts, Ground temperature, Wind chill, Precipitation, Precipitation type, Lightning, Collection of convective analysis fields:CAPE, CIN, LCL, Level of free convection,Lifted Index, Showalter Index, Deep ConvectionIndex, Trigger temperature, Trigger temperaturedeficit, Equivalent Pot. temperature, Moistureconvergence, Flow divergence, Precipitable water, Cloudiness, Visibility. This product is not publicly available yet
-
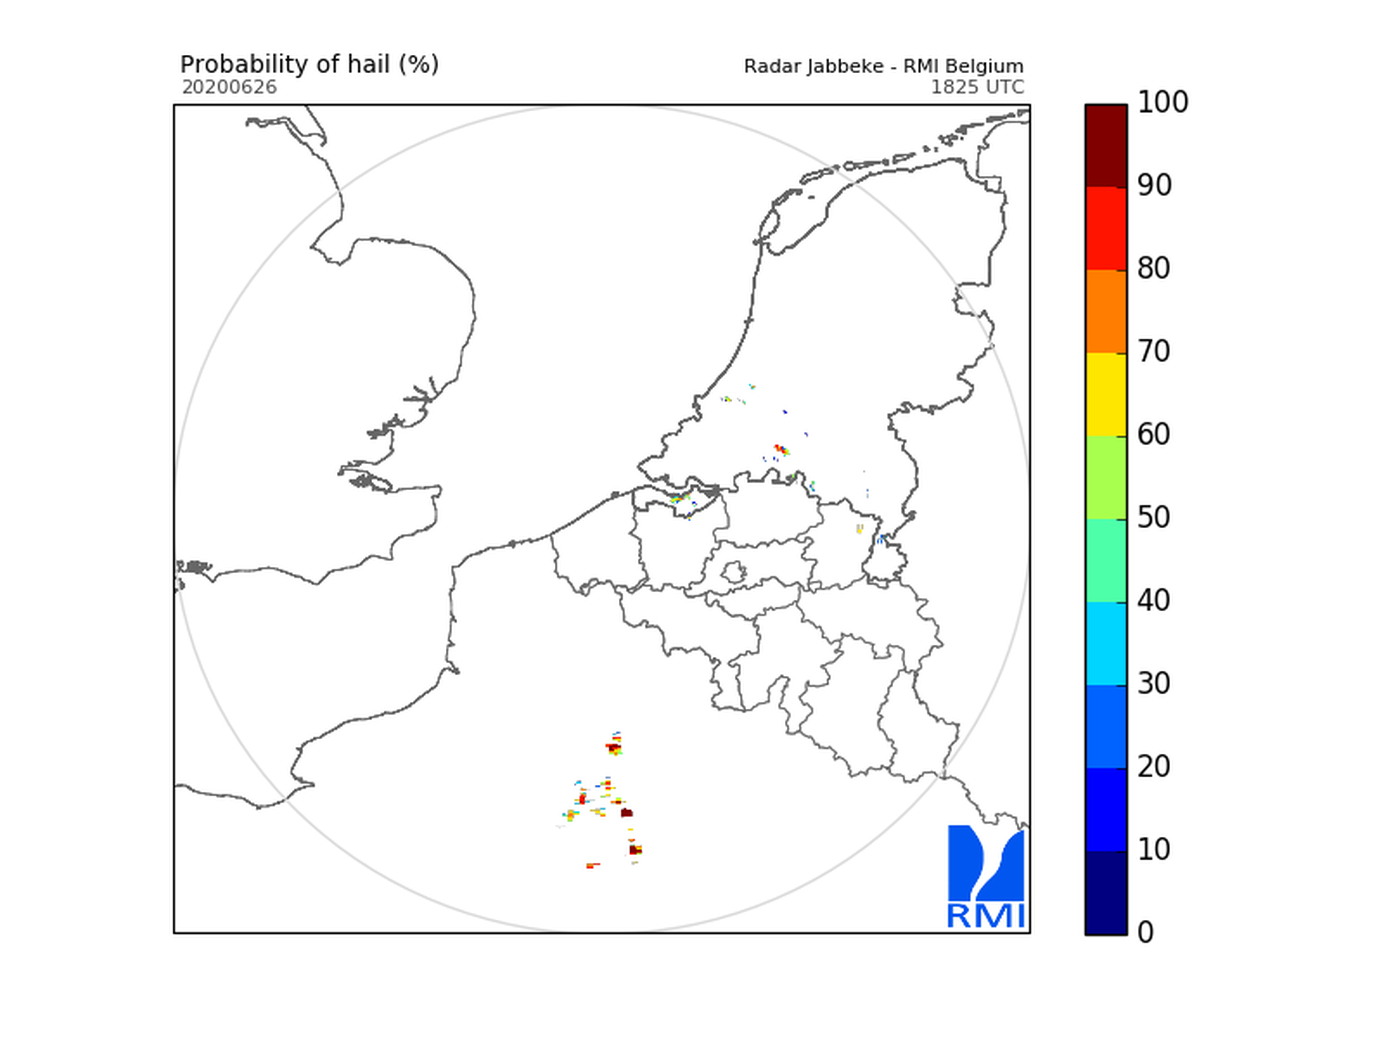
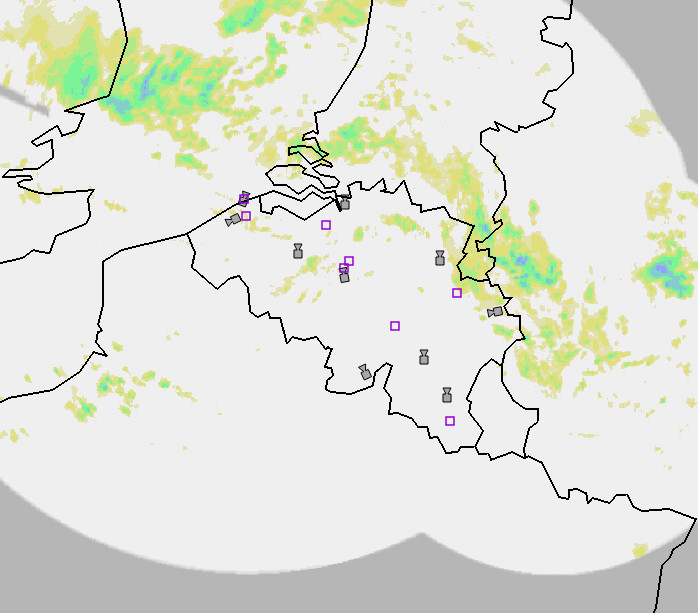
Hail products are derived from the observed vertical profiles of radar reflectivity and the NWP vertical profiles of temperature. Three types of products are generated. poh : probability of hail of any size (larger than 0.5 cm diameter)expressed in %. posh : probability of severe hail(larger than 2cm)expressed in %. mesh : maximum expected size of hailexpressed in mm of hailstone diameter. All products are generated every 5 minutes. This product is not publically available yet.
-
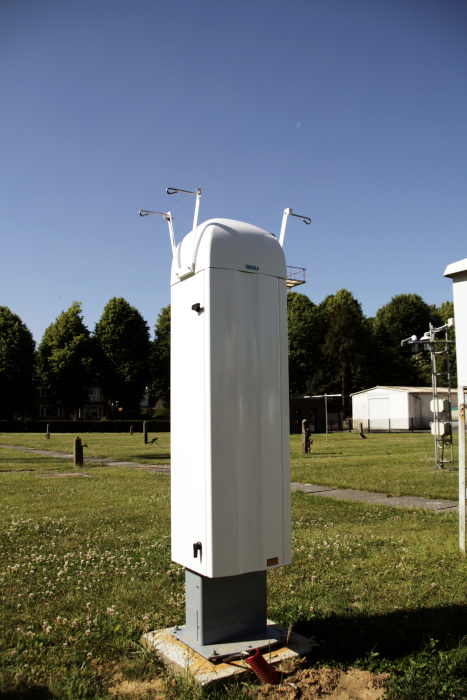
The ceilometer CL51 employs a pulsed diode laser LIDAR technology, where short, powerful laser pulses are sent out in a vertical or near-vertical direction. The reflection of light (backscatter) caused by clouds, precipitation or other obscuration is analysed and used to determine the cloud base height, the cloud layer height and the amount of clouds (in octas) in different layers.
-
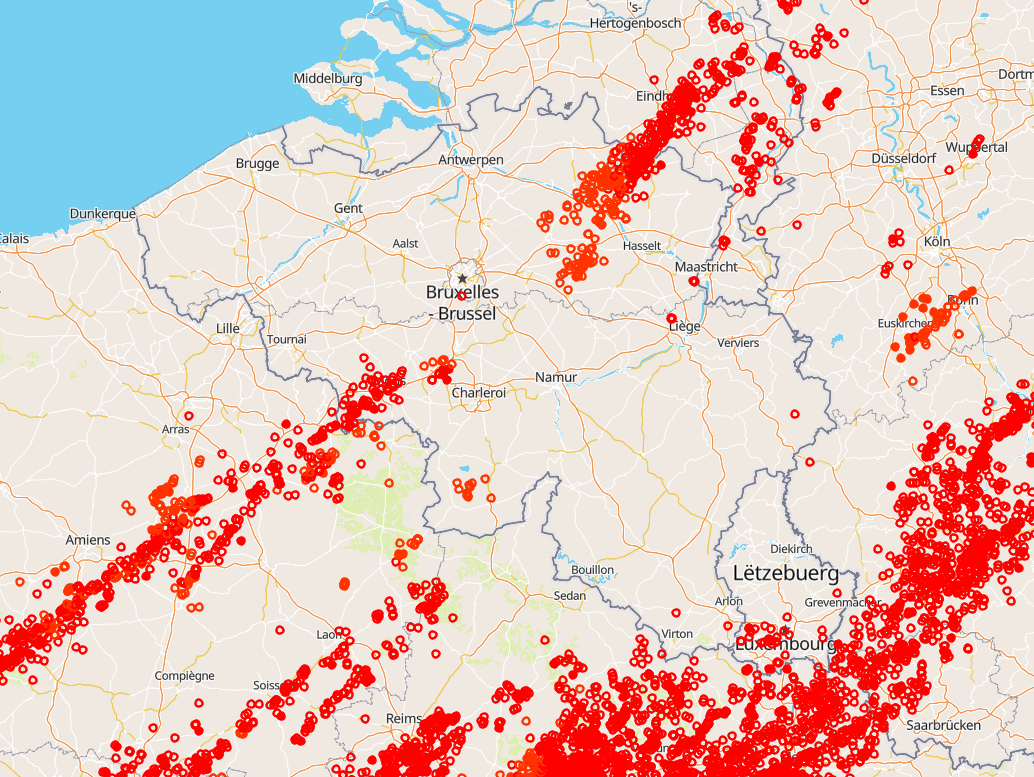
Total lightning observations, i.e., cloud-to-ground (CG) strokes and intra/inter-cloud (IC) pulses, in Belgium. BELLS data is given in Universal Time! (local time winter = UT +1; local time summer = UT + 2). Each record contains following fields: 1. Network type, 0 = LF, 1 = VHF-TOA, 2 = VHF-ITF, 3 = VLF 2. Year, 1970 to 2032. 3. Month, with January as 1 and December as 12. 4. Day of the month, 1 to 31. 5. Hour, 0 to 23. 6. Minute, 0 to 59. 7. Second, 0 to 60. 8. Nanosecond, 0 to 999999999. 9. Latitude of the calculated location in decimal degrees, to 4 decimal places, -90.0 to 90.0. 10. Longitude of the calculated location in decimal degrees, to 4 decimal places, -180.0 to 180.0. 11. Altitude in meters, -4950 to +60535. This field will be 0 if the altitude is not provided in the lightning data. 12. The altitude uncertainty in meters. This field will be 0 if the altitude uncertainty is not provided in the lightning data. 13. Estimated peak current in kiloamps, -9999 to 9999. 14. VHF Range normalized power, -9999.0 to 9999.0 15. Multiplicity for flash data (1 to 99) or 0 for strokes. 16. Cloud pulse count for the lightning record. This field will be -1 if the lightning did not contain the cloud pulse count attribute. 17. Number of sensors participating in the solution, 2 to 99. 18. Degrees of freedom when optimizing location, 0 to 99. 19. The error ellipse angle as a clockwise bearing from 0 degrees north, 0 to 180.0 degrees 20. The error ellipse semi-major axis length in kilometers, 0 to 50.0km. 21. The error ellipse semi-minor axis length in kilometers, 0 to 50.0km. 22. Chi-squared value from location optimization, 0 to 999.99 23. Rise time of the waveform in microseconds, 0 to 99.9 24. Peak-to-zero time of the waveform in microseconds, 0 to 999.9 25. Maximum rate-of-rise of the waveform in kA/usec (will be a negative rate if discharge is negative), -999.9 to 999.9 26. Cloud indicator, 1 if Cloud-to-cloud discharge, 0 for Cloud-to-ground 27. Angle indicator, 1 if sensor angle data used to compute position, 0 otherwise 28. Signal indicator, 1 if sensor signal data used to compute position, 0 otherwise 29. Timing indicator, 1 if sensor timing data used to compute position, 0 otherwise 30. Flash ID, a unique integer value identifying the flash grouping a stroke belongs to or 0 if not set. This product is not publically available yet.
-
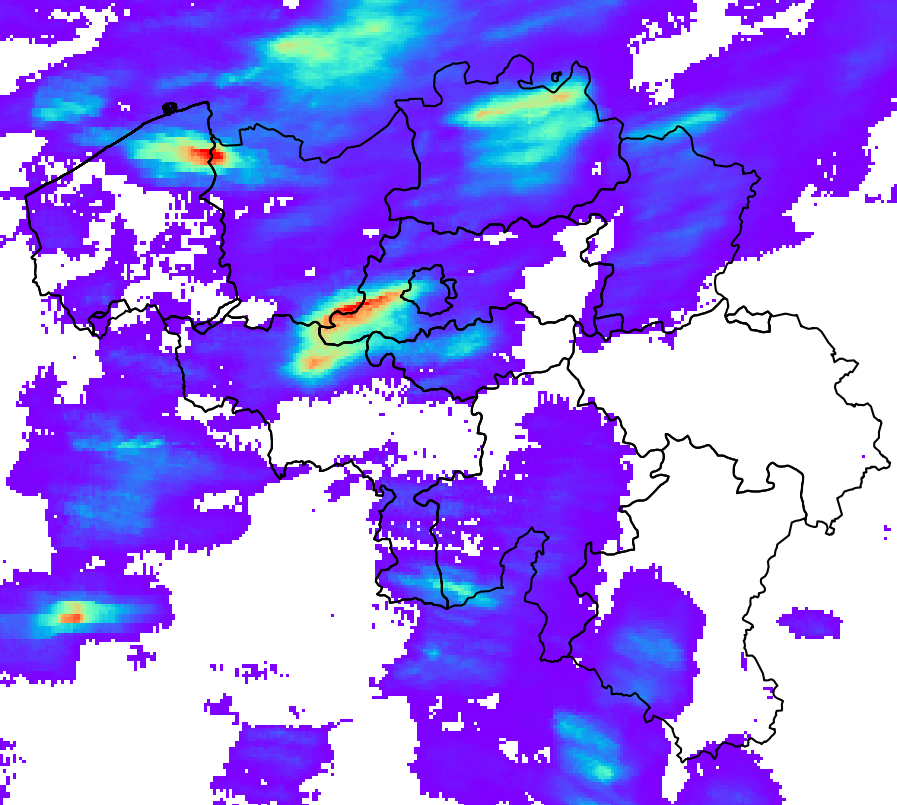
RADQPE provides high resolution radar-based quantitative precipitation estimation in realtime for Belgium and its surroundings. This product is not publically available yet.