 geo.be Metadata Catalog
asNeeded
Type of resources
Available actions
Topics
INSPIRE themes
federalThemes
Keywords
Contact for the resource
Provided by
Years
Formats
Representation types
Update frequencies
status
Service types
Scale
Resolution
-
The dataset shows in the form of polygons the sand and gravel extraction sites in the Belgian marine areas as defined by the successive marine spatial plans. A 2014 version illustrates the 2014-2020 plan while the 2020 version illustrates the 2020-2026 plan.
-
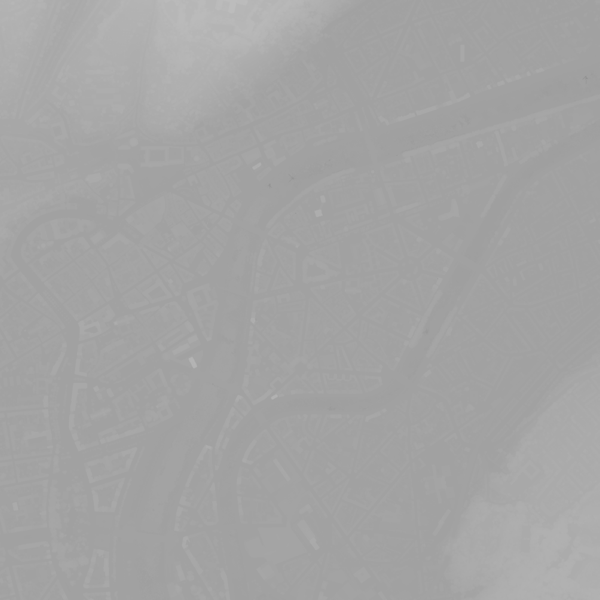
This webservice allows viewing a digital surface model. It is a homogeneous and regular points grid which indicates the height above the surface of the earth, either the soil or any other permanent and visible element in the landscape (vegetation, construction,…). These data represent the situation of the landscape resulting from the July 2021 floods in het areas of the Vesdre, of part of the Meuse downstream from Liège and of the Demer. The heights are given relative to the Belgian zero level (fictitious zero of Uccle). The data have a resolution (size of the meshes of the regular grid) of 20 cm.
-

This is the discovery service of the pan-European spatial datasets provided by the European mapping and cadastral agencies: EuroGlobalMap, EuroRegionalMap, EuroDEM, Open Cadastral Map, Pan-European Imagery, Open Gazetteer. The datasets are openly available accessible on the platform Open Maps for Europe (OME) http://www.mapsforeurope.org/.
-
This dataset contains the administrative units for the organisation of elections, within their boundaries as established by Annex I of the Electoral Code.
-
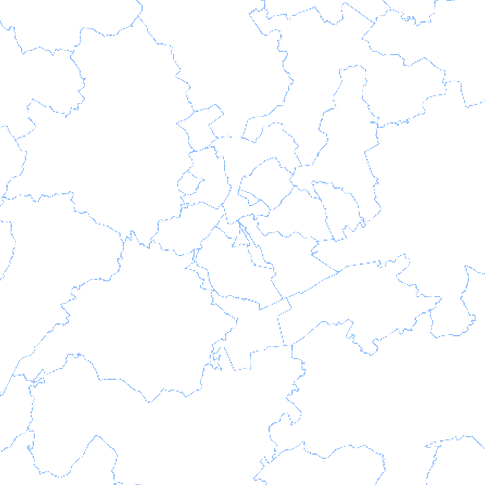
The data set has been established according to the INSPIRE format. It presents in the form of polygons the breakdown of Belgium in almost 20,000 statistical sectors. The statistical sector is the basic territorial unit resulting from the subdivision of the territory of municipalities by STATBEL since 1970 for the dissemination of its statistics at a finer level than the municipal level. A statistical sector cannot extend over two municipalities and any point in the municipal territory is part of one and the same statistical sector. The 1970 and 1981 versions are shown in analogue format while the 2001, 2011, 2018 and 2019 versions are available in digital vector format. The files can be linked to the data on population, housing and disposable income on the website of Statbel.
-
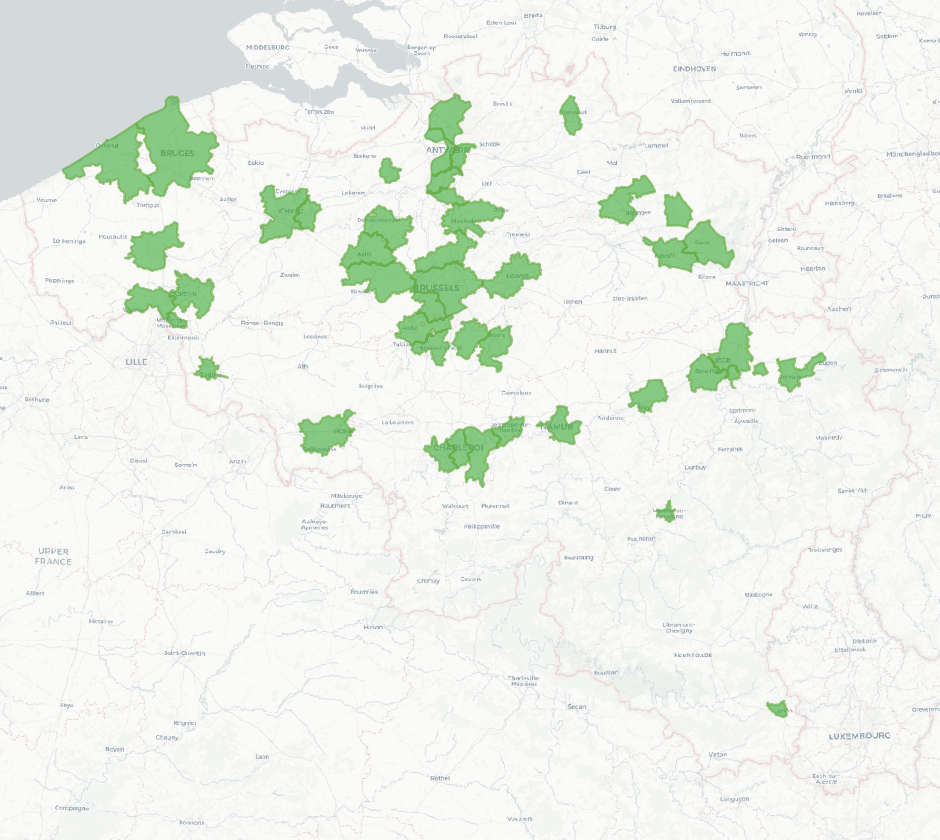
The National surveillance of SARS-CoV-2 monitors the SARS-CoV-2 presence in several wastewater treatment plants across Belgium. This dataset contains the catchment areas per wastewater treatment plant since the beginning of the surveillance is June 2020.
-
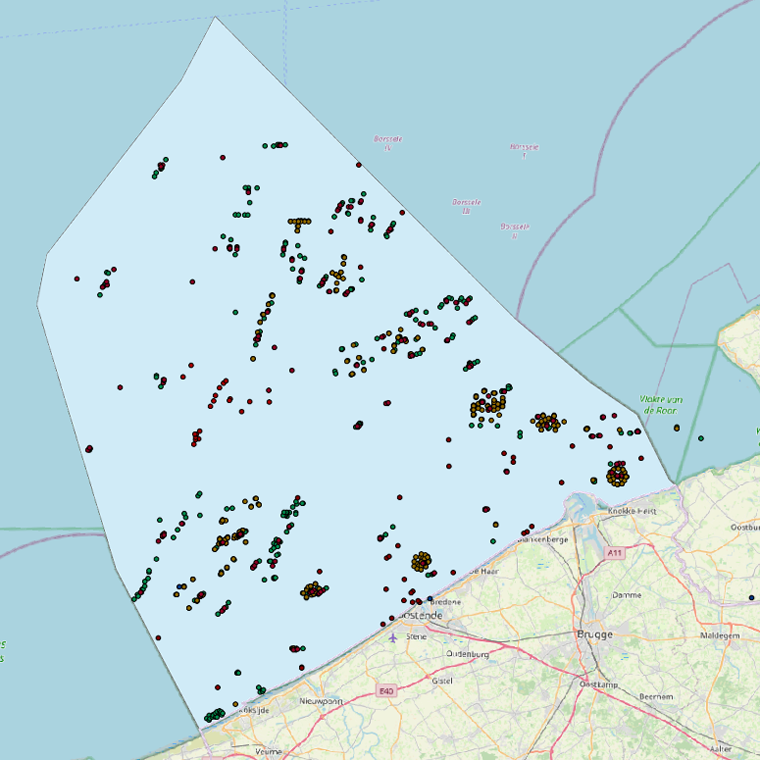
This web service allows viewing the datasets under the Marine Strategy Framework Directive (MSFD).
-
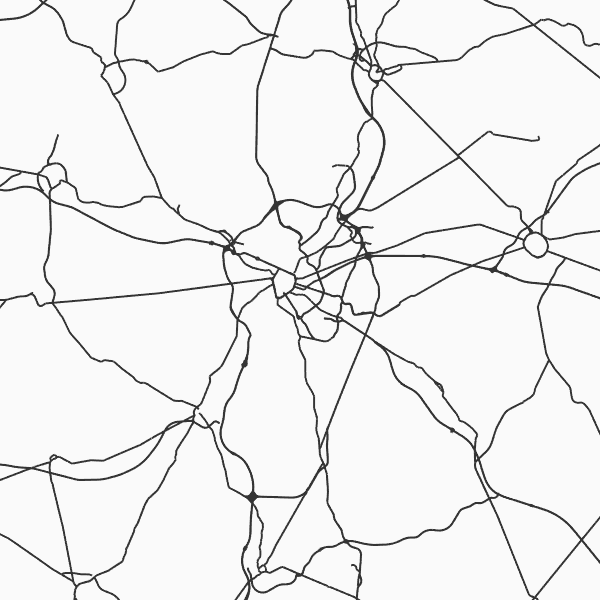
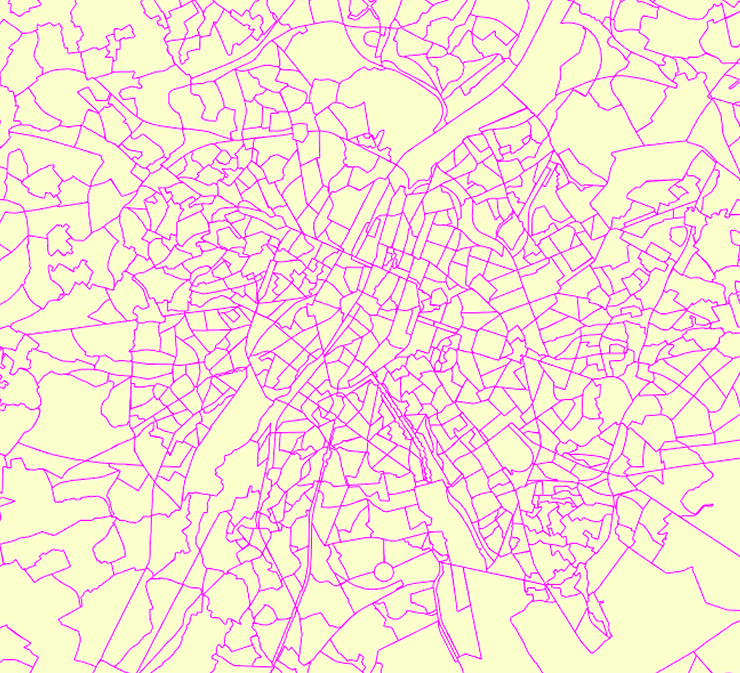
Top10Vector - Road network is the vector data set of the Belgian road network. It contains five classes. First class: dirt roads. Second class: kilometer markers along the road network. Third class: path segments. Fourth class: road obstructions. Fifth class: road segments. This data set aimt at representing the surface area of the road network on the Belgian territory and is not designed for route calculations. This data set can be bought via the corresponding hyperlink.
-
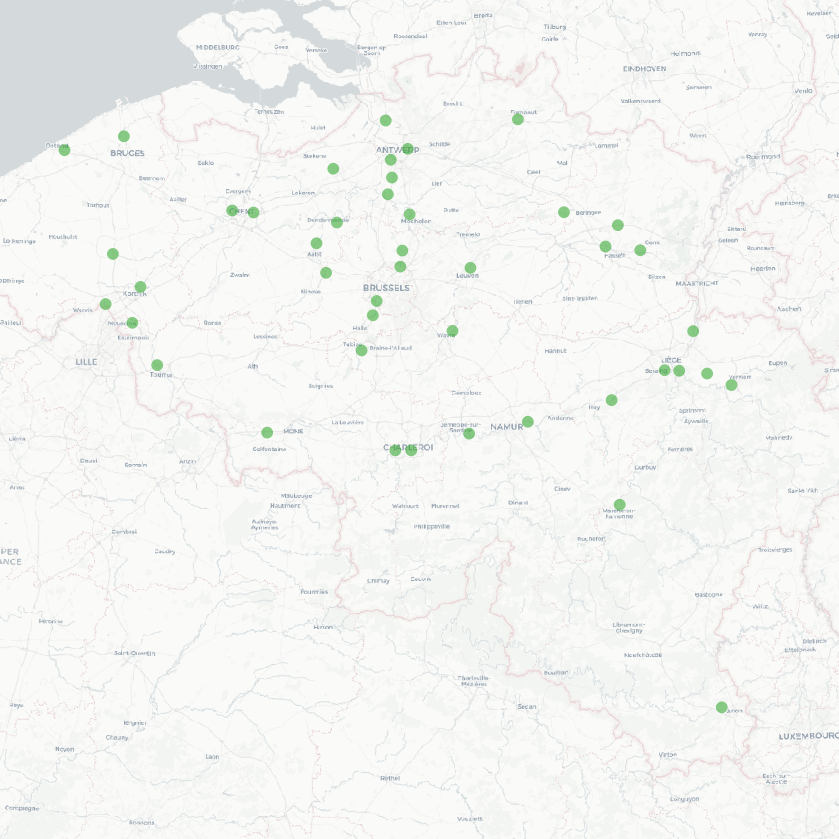
The National surveillance of SARS-CoV-2 monitors the SARS-CoV-2 presence in several wastewater treatment plants across Belgium. This download service contains the results per treatment plant since the beginning of the surveillance is June 2020. The results consist in the SARS-CoV2 concentrations over time as well as other data needed for the interpretations such as the flow rates of the treatment plants and their covering populations.
-
The National surveillance of SARS-CoV-2 monitors the SARS-CoV-2 presence in several wastewater treatment plants across Belgium. This webservice contains the results per treatment plant since the beginning of the surveillance is June 2020. The results consist in the SARS-CoV2 concentrations over time as well as other data needed for the interpretations such as the flow rates of the treatment plants and their covering populations.